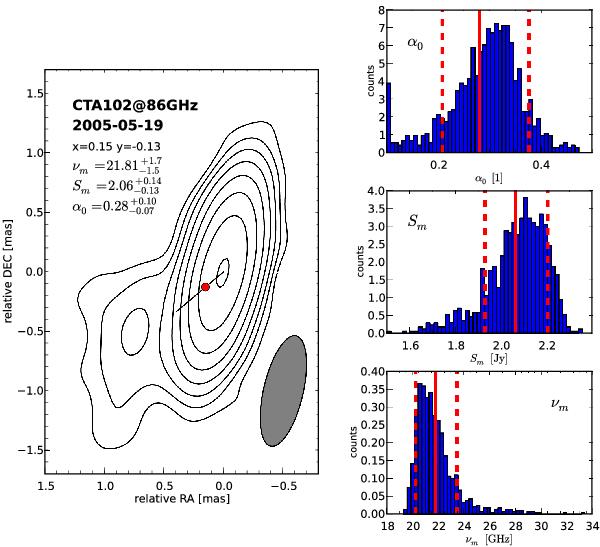
fig. D.2

Result of the Monte Carlo simulation for the May 2005 observations at the position x = 0.15 mas, y = −0.13 mas (relative to the brightness peak). The left panel shows the 86 GHz contours where the lowest contour is plotted at 5× the rms value and increased by factors of 2. The solid black line corresponds to the jet axis and the red point indicates the selected position. The right panels show from top to bottom the distribution of the optically thin spectral index, α0, the turnover flux-density, Sm, and the turnover frequency, νm. The solid red lines indicate the mean of the distribution and the dashed red lines one standard deviation. The values for the spectral values are plotted in the upper left corner of the contour plot. Notice the asymmetric error bars and the tailed distribution of the spectral parameters.
Current usage metrics show cumulative count of Article Views (full-text article views including HTML views, PDF and ePub downloads, according to the available data) and Abstracts Views on Vision4Press platform.
Data correspond to usage on the plateform after 2015. The current usage metrics is available 48-96 hours after online publication and is updated daily on week days.
Initial download of the metrics may take a while.


