Free Access
Fig. 16
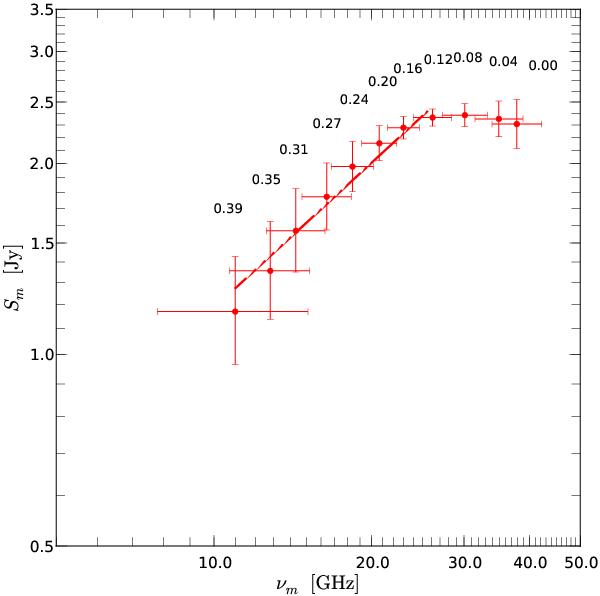
Turnover frequency–turnover flux-density plane for region C for the May 2005
observations. The number correspond to the distance from the core in mas and the
solid red line to a power law fit  .
.
Current usage metrics show cumulative count of Article Views (full-text article views including HTML views, PDF and ePub downloads, according to the available data) and Abstracts Views on Vision4Press platform.
Data correspond to usage on the plateform after 2015. The current usage metrics is available 48-96 hours after online publication and is updated daily on week days.
Initial download of the metrics may take a while.