Fig. 15
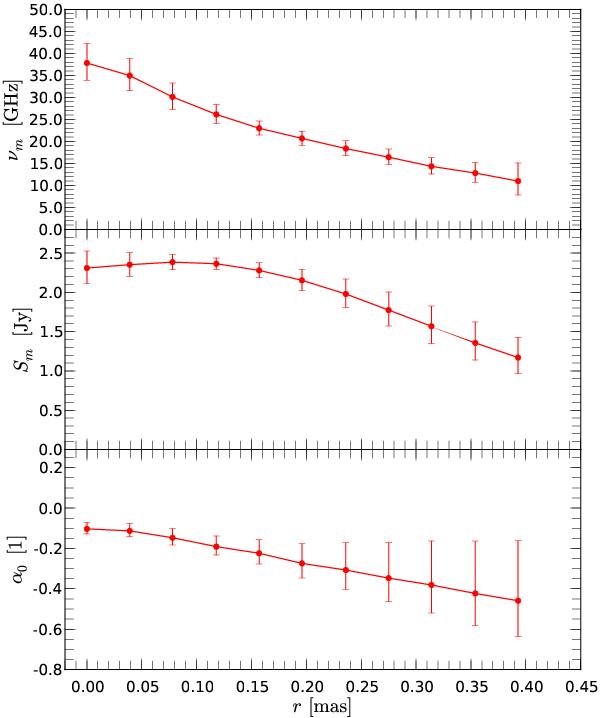
Spatial evolution of the turnover values along the jet ridge line for the May 2005 observation (2005.39). We used a beam size of 0.95 × 0.33 mas with a PA of −13° and pixel size of 0.03 mas. The error estimates were derived from a Monte Carlo simulation (see text for more details). Top panel: Turnover frequency, νm; middle panel: turnover flux-density, Sm; bottom panel: optically thin spectral index, α0
Current usage metrics show cumulative count of Article Views (full-text article views including HTML views, PDF and ePub downloads, according to the available data) and Abstracts Views on Vision4Press platform.
Data correspond to usage on the plateform after 2015. The current usage metrics is available 48-96 hours after online publication and is updated daily on week days.
Initial download of the metrics may take a while.