Fig. 11
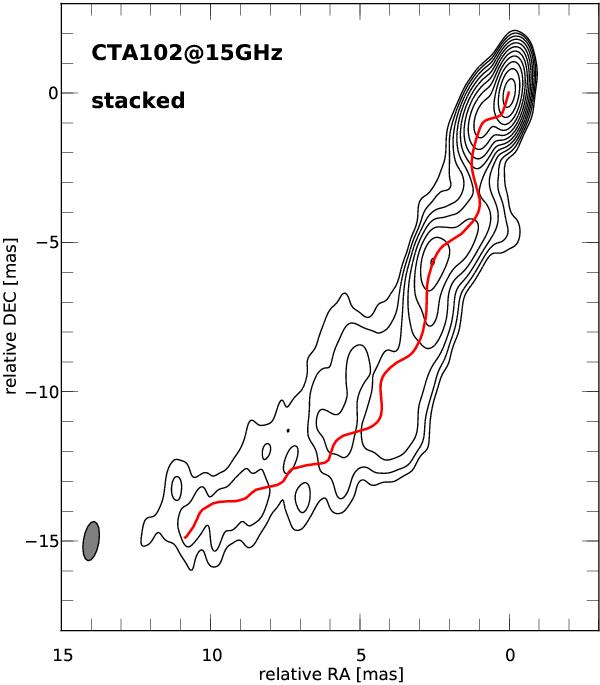
Stacked 15 GHz contour map of CTA 102 obtained from observations between 2005 and 2007 convolved with a common beam size of 1.33 mas × 0.52 mas and a PA of −9° with over-plotted jet ridge line. The lowest contour level is drawn at 5× the average off-source rms (4 mJy) and the contours increase in steps of 2.
Current usage metrics show cumulative count of Article Views (full-text article views including HTML views, PDF and ePub downloads, according to the available data) and Abstracts Views on Vision4Press platform.
Data correspond to usage on the plateform after 2015. The current usage metrics is available 48-96 hours after online publication and is updated daily on week days.
Initial download of the metrics may take a while.