Fig. 20
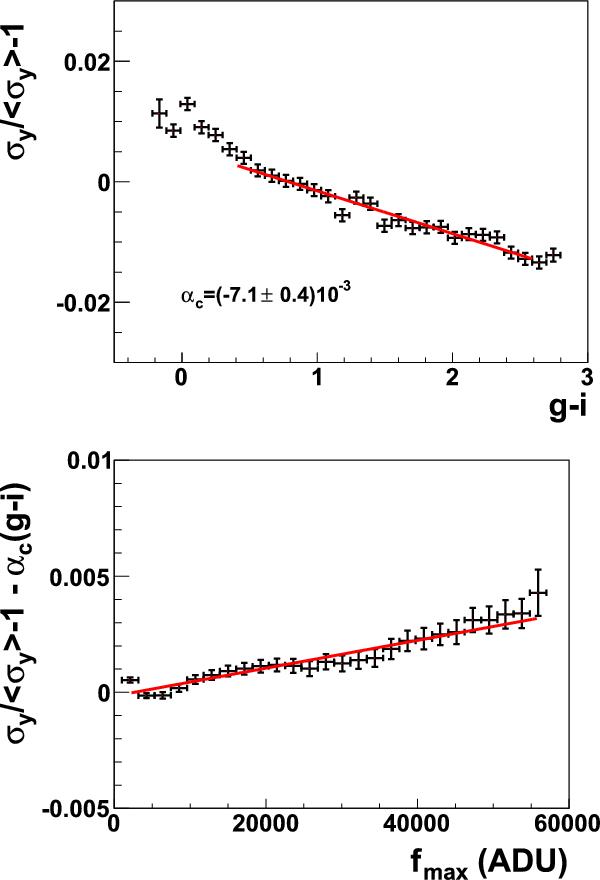
Relative difference of second moments of stars to the average (over 1 CCD), as a function of g − i color (top), for faint stars, and as a function of peak flux (bottom), correcting for the size-color relation Both plots display the science data, in g band. Values for the slopes in all bands are provided in Table 4.
Current usage metrics show cumulative count of Article Views (full-text article views including HTML views, PDF and ePub downloads, according to the available data) and Abstracts Views on Vision4Press platform.
Data correspond to usage on the plateform after 2015. The current usage metrics is available 48-96 hours after online publication and is updated daily on week days.
Initial download of the metrics may take a while.