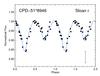
Fig. 2
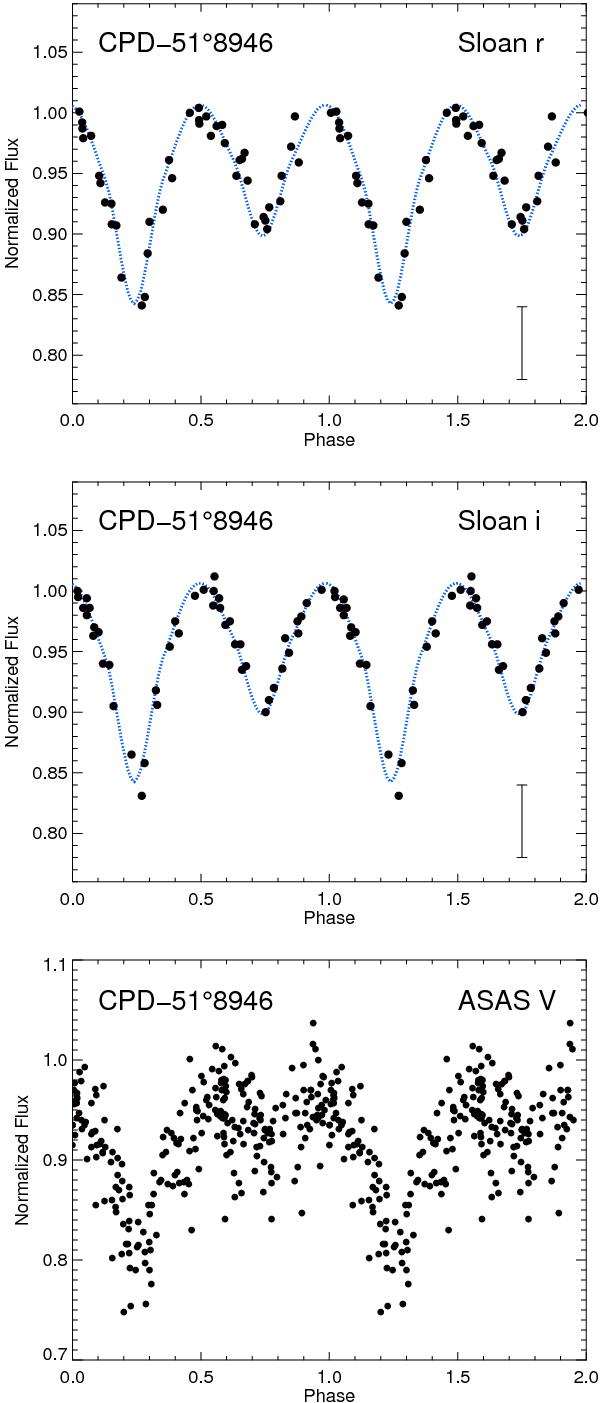
Observed (dots) and simulated (solid line) light curves in the r-Sloan (top) and i-Sloan (middle) bands, folded onto the orbital period (1.96 days) obtained from the PDM analysis. The error bar at the bottom of the plot represents the average measurement uncertainty for the data set. Bottom: The normalized V-band light curve obtained from the ASAS III catalogue folded with a period of 1.96 days.
Current usage metrics show cumulative count of Article Views (full-text article views including HTML views, PDF and ePub downloads, according to the available data) and Abstracts Views on Vision4Press platform.
Data correspond to usage on the plateform after 2015. The current usage metrics is available 48-96 hours after online publication and is updated daily on week days.
Initial download of the metrics may take a while.