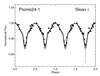
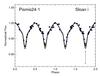
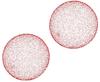
Fig. 1
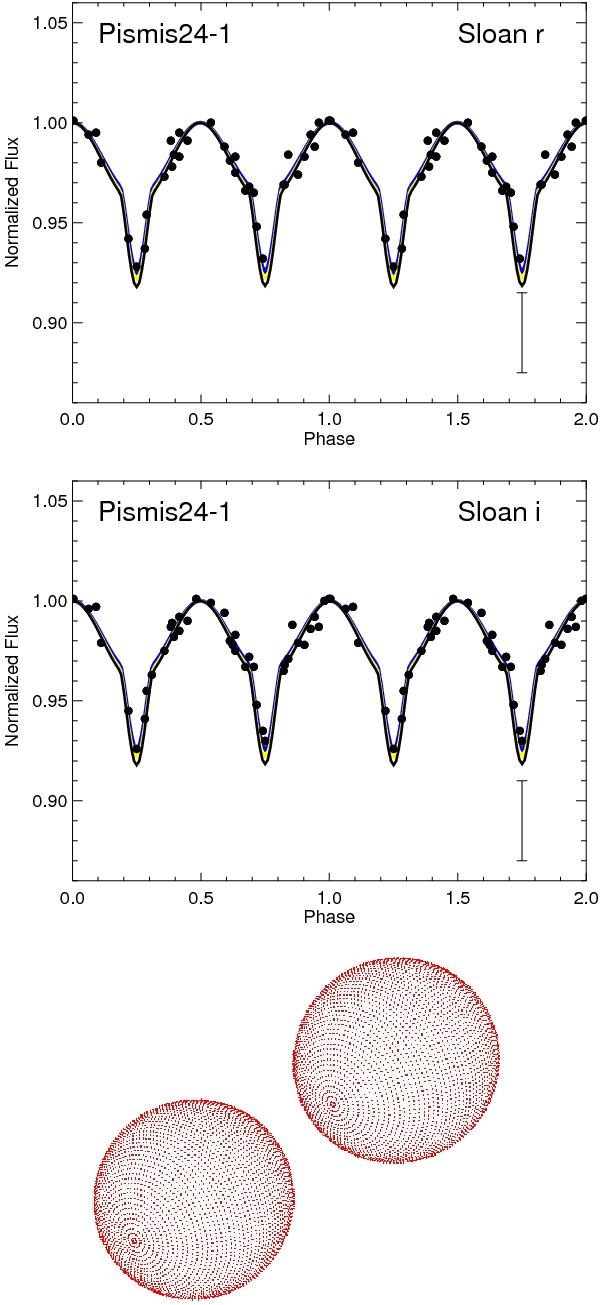
Observed light curves of Pismis 24-1 with the best-fitting model obtained at l3 = 0.15 (yellow solid line) in the Sloan r (top) and Sloan i (middle) bands, folded onto the orbital period of 2.36 days. The error bar at the bottom of the plot represents the average measurement uncertainty for the data set. The blue and black solid lines correspond to the solutions obtained at l3 = 0.1 and l3 = 0.2, respectively. Bottom: 3D view of the system Pismis 24-1 at an orbital phase of 0.12.
Current usage metrics show cumulative count of Article Views (full-text article views including HTML views, PDF and ePub downloads, according to the available data) and Abstracts Views on Vision4Press platform.
Data correspond to usage on the plateform after 2015. The current usage metrics is available 48-96 hours after online publication and is updated daily on week days.
Initial download of the metrics may take a while.