Fig. 6
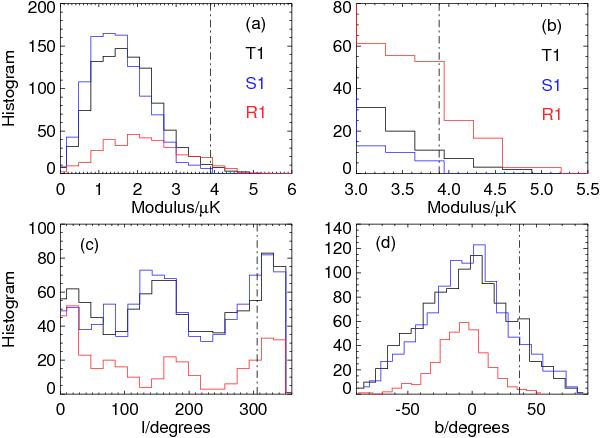
a) Histograms of 1000 dipoles measured from ten simulated filtered maps for the W1 DA. For each map, dipoles were computed placing the template at 100 random positions. The solid black and blue lines show the results obtained for the template of real clusters, T1, and for the simulated template of randomly positioned clusters, S1, respectively. For comparison, the solid red line shows the distribution of 360 dipoles computed by rotating the T1 template on a simulated map. b) As a) but focusing on the 3−5.5 μk range and showing the R1 renormalized to a total of 1000 to facilitate the comparison of the three error estimators. Panels c) and d) show the distribution of the dipole directions in Galactic coordinates. In all panels, the vertical dot-dashed line represents the measured dipole according to Kashlinsky et al. (2010).
Current usage metrics show cumulative count of Article Views (full-text article views including HTML views, PDF and ePub downloads, according to the available data) and Abstracts Views on Vision4Press platform.
Data correspond to usage on the plateform after 2015. The current usage metrics is available 48-96 hours after online publication and is updated daily on week days.
Initial download of the metrics may take a while.