Fig. 5
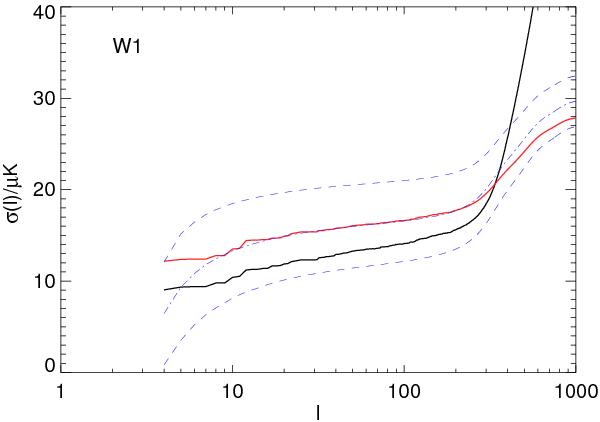
Contribution to the rms dispersion of all multipoles up to ℓ (see Eq. (3)) for the WMAP W1 band. The thick solid (black) line corresponds to WMAP data, the thin solid (red) line to the best-fit concordance model  , the dot-dashed (blue) line is the mean of 1000 simulations containing only CMB, and the symmetric dashed (blue) lines mark the 1σ dispersion around the mean.
Current usage metrics show cumulative count of Article Views (full-text article views including HTML views, PDF and ePub downloads, according to the available data) and Abstracts Views on Vision4Press platform.
Data correspond to usage on the plateform after 2015. The current usage metrics is available 48-96 hours after online publication and is updated daily on week days.
Initial download of the metrics may take a while.