Free Access
Fig. 4
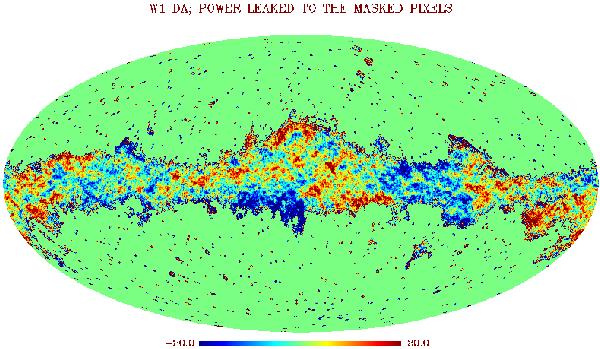
Residual power in a simulated map. We use the WMAP 7-year KQ75 mask. For clarity, the power outside the mask is set to zero and the plot is limited to the range [− 20,20] μk. Points above/below the specified range were given the value of the upper/lower bound. Note the power leaked to the masked-out region of the sky.
Current usage metrics show cumulative count of Article Views (full-text article views including HTML views, PDF and ePub downloads, according to the available data) and Abstracts Views on Vision4Press platform.
Data correspond to usage on the plateform after 2015. The current usage metrics is available 48-96 hours after online publication and is updated daily on week days.
Initial download of the metrics may take a while.