Fig. 1
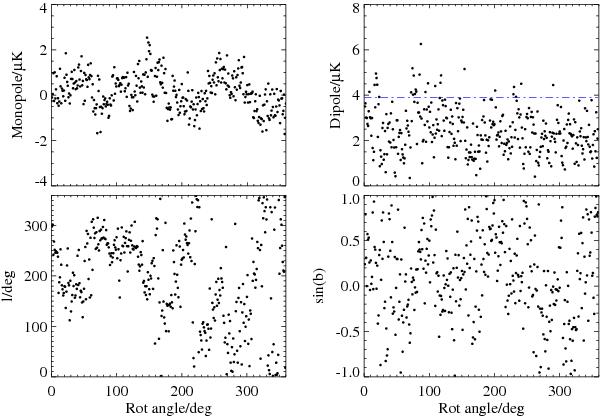
Monopole and dipole components evaluated at locations obtained by rotating the T1 cluster template about the Z axis. The dot-dashed (blue) line shown in the upper right panel marks the amplitude measured at zero rotation. The bottom two panels show the direction of the dipole measured for a given rotation angle. Note the pronounced inhomogeneities in the resulting sampling of all possible random dipoles, as well as the 120° periodicity in the amplitude of the monopole.
Current usage metrics show cumulative count of Article Views (full-text article views including HTML views, PDF and ePub downloads, according to the available data) and Abstracts Views on Vision4Press platform.
Data correspond to usage on the plateform after 2015. The current usage metrics is available 48-96 hours after online publication and is updated daily on week days.
Initial download of the metrics may take a while.