Fig. B.42
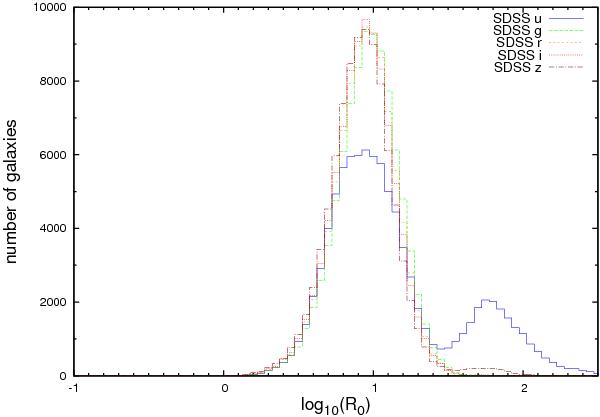
Distributions of the logarithm of the physical radius log 10(R0) in different filters for the p model are well described by sharp Gaussian with their peaks almost exactly at the same value. However, the u band shows a peculiar second peak aside the consequently smaller (in comparison to the other filters) main one. In addition to this deviation, the z band distribution has a small bump at its larger end.
Current usage metrics show cumulative count of Article Views (full-text article views including HTML views, PDF and ePub downloads, according to the available data) and Abstracts Views on Vision4Press platform.
Data correspond to usage on the plateform after 2015. The current usage metrics is available 48-96 hours after online publication and is updated daily on week days.
Initial download of the metrics may take a while.