Fig. 6
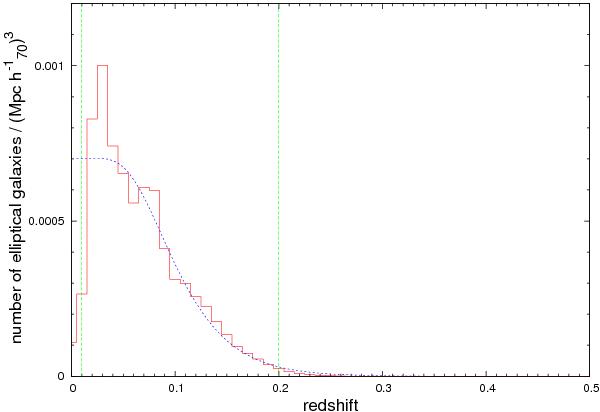
Redshift distribution of the number density of elliptical galaxies in our sample. The measured density of elliptical galaxies is given by the red solid line of the histogram. We divided our sample into redshift bins with a width of 0.01. The blue dashed line represents our best-fit model to the data. The green dashed vertical lines indicate the limits of the sample, which were used for the fundamental plane fitting.
Current usage metrics show cumulative count of Article Views (full-text article views including HTML views, PDF and ePub downloads, according to the available data) and Abstracts Views on Vision4Press platform.
Data correspond to usage on the plateform after 2015. The current usage metrics is available 48-96 hours after online publication and is updated daily on week days.
Initial download of the metrics may take a while.