Fig. B.32
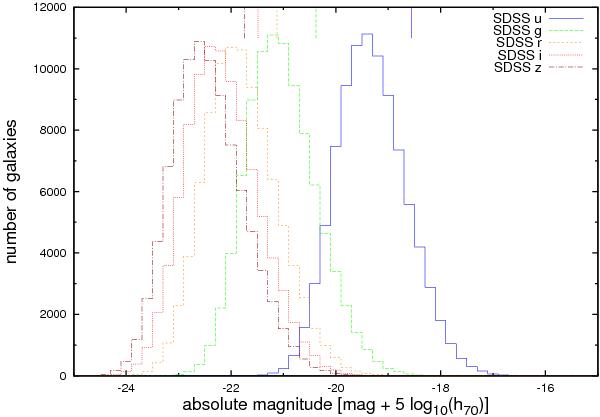
Comparison of the luminosity functions in different filters for the p model. Although their shapes stay approximately the same, the peaks move to higher luminosities with redder filters. The short lines in the upper part of the plot indicate the Malmquist-bias-corrected mean magnitudes of our sample in the corresponding filters.
Current usage metrics show cumulative count of Article Views (full-text article views including HTML views, PDF and ePub downloads, according to the available data) and Abstracts Views on Vision4Press platform.
Data correspond to usage on the plateform after 2015. The current usage metrics is available 48-96 hours after online publication and is updated daily on week days.
Initial download of the metrics may take a while.