Fig. 5
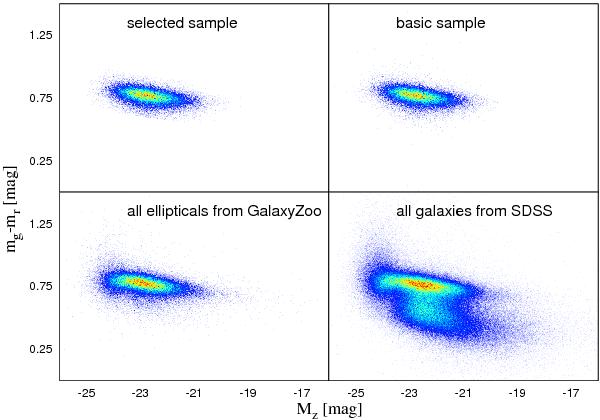
Selection of our sample illustrated using colour−magnitude diagrams. This set of g − r colour versus z band absolute magnitude diagrams shows that with our constraints only the red sequence remains in the selected sample (top left panel) of about 95 000 galaxies, which is used to fit the fundamental plane. The basic sample (top right panel), which consists of 100 427 galaxies, is already relatively clean by itself. The 170 234 candidates of elliptical galaxies from GalaxyZoo can be found in the bottom left panel. The bottom right panel shows 852 173 unclassified galaxies with proper spectroscopic data from the SDSS database and in this plot, other structures in the colour magnitude diagram, such as the blue cloud, are clearly visible as well. The colour-coding in the plots is always relative to the maximum number density per pixel. Red indicates the maximum number density (which can vary from figure to figure) per pixel. Colours between red and orange cover number densities between the maximum and 2/3 of the maximum. Shades from yellow to green cover the range between ~2/3 and ~1/3 of the maximum number density. Shades from cyan to blue indicate less than ~1/3 of the maximum number density. White pixels contain no objects. The same colour scheme is used for all other density map plots in this paper as well.
Current usage metrics show cumulative count of Article Views (full-text article views including HTML views, PDF and ePub downloads, according to the available data) and Abstracts Views on Vision4Press platform.
Data correspond to usage on the plateform after 2015. The current usage metrics is available 48-96 hours after online publication and is updated daily on week days.
Initial download of the metrics may take a while.