Fig. 17
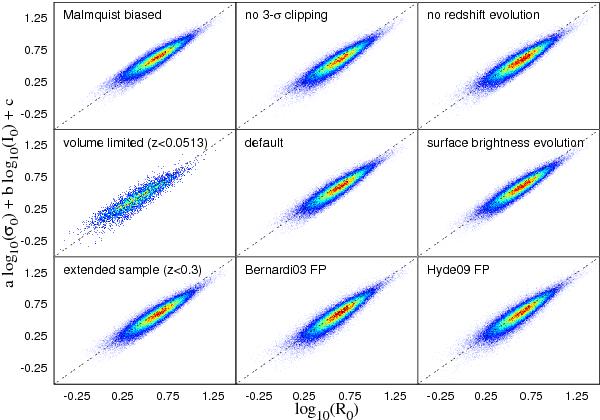
Results for the fundamental plane in the i band for the dV model using our alternatives fits. The plot in the top-left panel does not include the Malmquist bias. We did not perform a 3-σ clipping for the plot in the top-middle panel. The plot in the top-right panel excludes the redshift evolution. The results of the volume-limited sample (z < 0.0513) can be found in the central-left panel. The central-middle panel contains a plot of the default i band fit for the dV model for comparison. We are considering the surface brightness evolution instead of the redshift evolution derived form galaxy number densities in the central-right panel. In the bottom-left panel, the results are shown for an extended sample up to z = 0.3. The fundamental plane plotted using the coefficients of Bernardi et al. (2003c), but with our sample data is displayed in the bottom-middle panel. A similar plot using the coefficients of Hyde & Bernardi (2009) can be found in the bottom-right panel.
Current usage metrics show cumulative count of Article Views (full-text article views including HTML views, PDF and ePub downloads, according to the available data) and Abstracts Views on Vision4Press platform.
Data correspond to usage on the plateform after 2015. The current usage metrics is available 48-96 hours after online publication and is updated daily on week days.
Initial download of the metrics may take a while.