Fig. 11
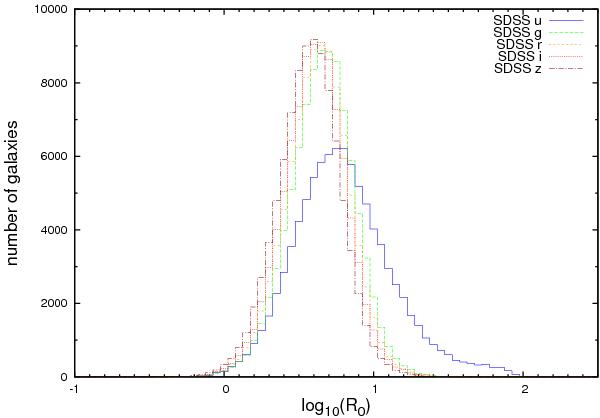
Distributions of the logarithm of the physical radius log 10(R0) in different filters for the dV model can be well described by sharp Gaussian with their peaks almost exactly at the same value. Only the u band shows some digressive behaviour. In this case the peak is smaller and set apart from the other. Furthermore, the distribution is wider and it shows a small bump at the larger end.
Current usage metrics show cumulative count of Article Views (full-text article views including HTML views, PDF and ePub downloads, according to the available data) and Abstracts Views on Vision4Press platform.
Data correspond to usage on the plateform after 2015. The current usage metrics is available 48-96 hours after online publication and is updated daily on week days.
Initial download of the metrics may take a while.