Fig. 1
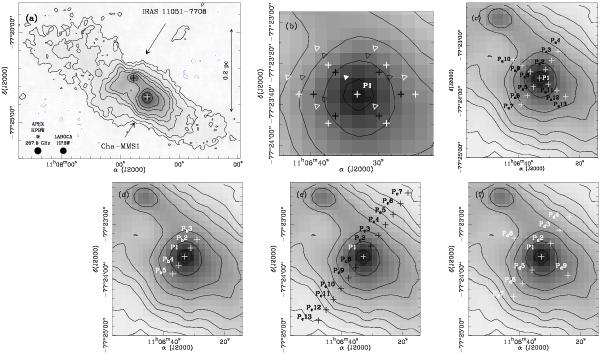
a) 870 μm map of the filament in which Cha-MMS1 is
embedded, obtained with LABOCA as part of an unbiased survey of Chamaeleon I (Belloche et al. 2011a). The contour levels
correspond to − a, a, 2a,
4a, 6a, 8a, 12a,
16a, 24a, 32a, with
a = 36 mJy/21″-beam (3σ). The white cross at
αJ2000 = 11h06m33 13,
δJ2000 =
−77°23′35.1′′ is the Spitzer
position of Cha-MMS1. The position of the nearby Class I object IRAS
11051-7706 is also shown with a black cross. b)−f) Zoom-in
of the positions (P, white/black crosses/triangles) observed with APEX and Mopra.
P1 is the central position. Panel b) refers to CO 6−5 (white
crosses), 13CO 6−5 (white crosses), and CO 7−6 (black crosses); c)
to HCO+ 3−2 and H13CO+ 3−2; d) to
CS 5−4, H13CO+ 4−3, and CO 4−3; e) to
C17O 2−1 and C18O 2−1 (all with APEX); and f) to
the Mopra observations (see Table 3). The
spacing between adjacent positions is 11.4′′ in panels c) and
d), and 14′′ in panel e). In panel
f), it is 17.5′′ for the positions perpendicular to the
filament and 35′′ for the positions along the filament. For panel b)
the pixel spacing of the CHAMP+ array is 20′′ for the
white and 15′′ for the black crosses relative to P1. The black (CO 7−6) and
white (CO 6−5) open triangles mark the positions observed with CHAMP+
centred on the offset position at (5.3′′, 8.3′′) relative to
Cha-MMS1 (filled triangle).
13,
δJ2000 =
−77°23′35.1′′ is the Spitzer
position of Cha-MMS1. The position of the nearby Class I object IRAS
11051-7706 is also shown with a black cross. b)−f) Zoom-in
of the positions (P, white/black crosses/triangles) observed with APEX and Mopra.
P1 is the central position. Panel b) refers to CO 6−5 (white
crosses), 13CO 6−5 (white crosses), and CO 7−6 (black crosses); c)
to HCO+ 3−2 and H13CO+ 3−2; d) to
CS 5−4, H13CO+ 4−3, and CO 4−3; e) to
C17O 2−1 and C18O 2−1 (all with APEX); and f) to
the Mopra observations (see Table 3). The
spacing between adjacent positions is 11.4′′ in panels c) and
d), and 14′′ in panel e). In panel
f), it is 17.5′′ for the positions perpendicular to the
filament and 35′′ for the positions along the filament. For panel b)
the pixel spacing of the CHAMP+ array is 20′′ for the
white and 15′′ for the black crosses relative to P1. The black (CO 7−6) and
white (CO 6−5) open triangles mark the positions observed with CHAMP+
centred on the offset position at (5.3′′, 8.3′′) relative to
Cha-MMS1 (filled triangle).
Current usage metrics show cumulative count of Article Views (full-text article views including HTML views, PDF and ePub downloads, according to the available data) and Abstracts Views on Vision4Press platform.
Data correspond to usage on the plateform after 2015. The current usage metrics is available 48-96 hours after online publication and is updated daily on week days.
Initial download of the metrics may take a while.