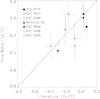
Fig. 1
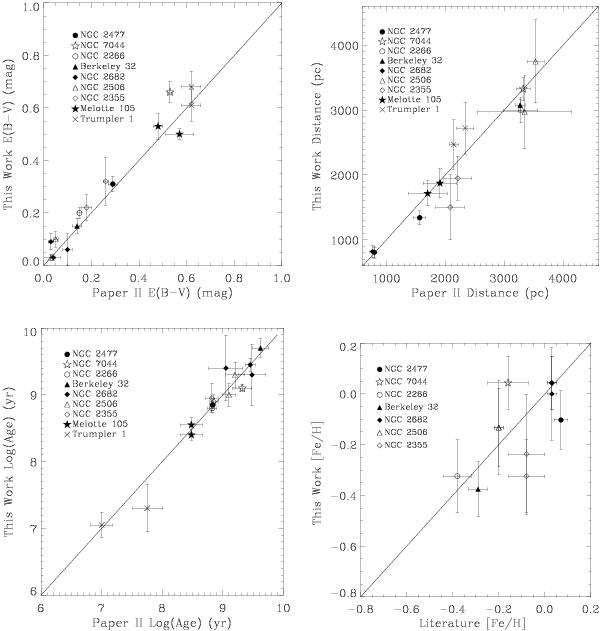
Comparison of our fit results with those of Paper II for E(B − V), distance and age (upper left, right and lower left respectively). Comparison of final estimated metallicity values with those from the literature are given in the lower right plot. The error bars are those presented in Table 2 for the fits as explained in the text. The lines of 45° are the loci of equal values. The [Fe/H] values obtained are compared with those from the DAML02 catalog. The filled symbols indicate [Fe/H] from high-resolution spectra.
Current usage metrics show cumulative count of Article Views (full-text article views including HTML views, PDF and ePub downloads, according to the available data) and Abstracts Views on Vision4Press platform.
Data correspond to usage on the plateform after 2015. The current usage metrics is available 48-96 hours after online publication and is updated daily on week days.
Initial download of the metrics may take a while.