Fig. 5
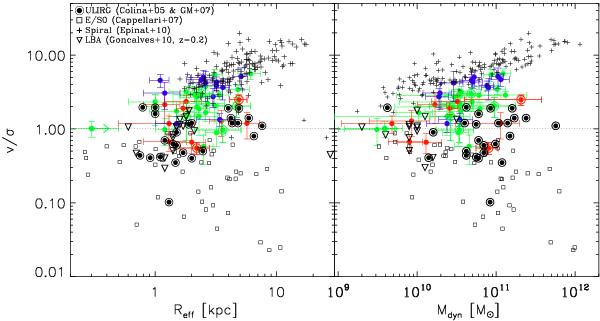
Observed (i.e., not inclination corrected) v/σ ratio as a function of the effective radius Reff (left panel) and dynamical mass Mdyn (right panel) is shown (see text). The colors used are the same as in the previous figures (i.e., blue for isolated disks, green for interacting galaxies and red for mergers). We identify ULIRGs with a second circle around the dots. The other samples are represented as follows: the nearby isolated spiral galaxies from the GHASP survey (see Epinat et al. 2010) are represented with cross symbols. Local ellipticals and lenticular objects, drawn from Cappellari et al. (2007), are shown with empty squares. LBAs, drawn from Gonçalves et al. (2010), are represented with empty downward triangles, with values derived using the Pa-α line. For these three samples, the effective radii Reff, dynamical ratios v/σ, and dynamical masses Mdyn have been derived as explained in the caption of Table 3. We finally add the ULIRG systems studied in Colina et al. (2005) and those studied in García-Marín et al. (2007) (i.e., empty circle surrounding the black solid dot). In general, Colina et al. (2005) derived their effective radius from the H-band measured using F160W Near Infrared Camera and Multi-Object Spectrometer (NICMOS/HST) images (only for two sources were the F814W WFPC2/HST images used instead). In García-Marín et al. (2007) the effective radius considered is the one derived from the I-band (i.e., F814W) images. For both of the samples, their v/σ ratio is obtained considering the half peak-to-peak velocity difference, and the central velocity dispersion σc, applying one Gaussian component fitting to the Hα emission line data. Their dynamical masses are derived using a constant of K = 7.5 (see footnote 9 for further details) and the central velocity dispersion σc (Colina et al. 2005).
Current usage metrics show cumulative count of Article Views (full-text article views including HTML views, PDF and ePub downloads, according to the available data) and Abstracts Views on Vision4Press platform.
Data correspond to usage on the plateform after 2015. The current usage metrics is available 48-96 hours after online publication and is updated daily on week days.
Initial download of the metrics may take a while.