| Issue |
A&A
Volume 556, August 2013
|
|
|---|---|---|
| Article Number | A78 | |
| Number of page(s) | 5 | |
| Section | Planets and planetary systems | |
| DOI | https://doi.org/10.1051/0004-6361/201321660 | |
| Published online | 31 July 2013 | |
Study of the impact of the post-MS evolution of the host star on the orbits of close-in planets⋆
II. A giant planet in a close-in orbit around the RGB star HIP 63242
1 Departamento de AstronomíaUniversidad de Chile, Camino El Observatorio 1515, Las Condes, Santiago, Chile
e-mail: This email address is being protected from spambots. You need JavaScript enabled to view it.
2 European Southern Observatory, Casilla 19001, Santiago, Chile
3 Departamento de Astronomía, Universidad de Concepción, Casilla 160-C, Concepción, Chile
Received: 5 April 2013
Accepted: 31 May 2013
Abstract
Context. More than 40 planets have been found around giant stars, revealing a lack of systems orbiting interior to ~0.6 AU. This observational fact contrasts with the planetary population around solar-type stars and has been interpreted as the result of the orbital evolution of planets through the interaction with the host star and/or because of a different formation/migration scenario of planets around more massive stars.
Aims. We are conducting a radial velocity study of a sample of 166 giant stars aimed at studying the population of close-in planets orbiting post-main sequence stars.
Methods. We computed precision radial velocities from multi-epoch spectroscopic data to search for planets around giant stars.
Results. We present the discovery of a massive planet around the intermediate-mass giant star HIP 63242. The best Keplerian fit to the data leads to an orbital distance of 0.57 AU, an eccentricity of 0.23 and a projected mass of 9.2 MJ. HIP 63242 b is the innermost planet detected around any intermediate-mass giant star and also the first planet detected in our survey.
Key words: stars: horizontal-branch / planet-star interactions / stars: late-type / planetary systems / stars: individual: HIP 63242
Based on observations collected at La Silla – Paranal Observatory under programs ID’s 085.C-0557, 087.C.0476, 089.C-0524, and 090.C-0345.
© ESO, 2013
1. Introduction
So far, more than 900 exoplanets have been detected1, most of them by the radial velocity (RV) technique. The detection of planets by this method is strongly biased to solar-like host stars, which have low rotational velocity and low levels of stellar activity (e.g. Jenkins et al. 2013). Fast rotation broadens the spectral lines, preventing us from computing precision RV variations, whereas stellar activity and spots produce spectral line assymmetries, which might mimic the Doppler-shift induced by a substellar companion (e.g. Queloz et al. 2001; Huelamo et al. 2008). In addition, very low mass stars are too cool and present strong molecular bands in their spectra, which hampers computing precision RVs, therefore generally only the slowest rotators are targeted (see Jenkins et al. 2009; Barnes et al. 2012). On the other hand, main-sequence (MS) stars more massive than ~1.3 M⊙ (corresponding to spectral types earlier than ~F5) are too hot and rotate fast, which leads to an optical spectrum dominated by few and broad absorption lines. However, after the MS, early-type stars become cooler and rotate slower than their MS progenitors (e.g. Schrijver & Pols 1993; Rutten & Pylyser 1988), and hence present many narrow absorption lines in their optical spectra. Also, even though they exhibit a higher level of activity than solar-type stars, giants with B − V color <1.2 are quite stable, and show a stellar jitter at the ~20 m s-1 level (Sato et al. 2005; Hekker et al. 2006; Jones et al., in prep.). Therefore, evolved stars present an ideal case for applying the RV technique to search for planets orbiting intermediate-mass stars (1.3 ≲ M⋆/M⊙ ≲ 3.0) and to study the post-MS star-planet interactions.
To date, ~100 exoplanets have been detected around post-MS stars (including subgiants), revealing different orbital properties than the planetary population orbiting FGK dwarfs. Figure 1 shows the semi-major axis distribution versus the mass of the host stars for all known planets. The small black dots, blue stars and red filled circles correspond to MS, subgiants and giant host stars, respectively. The red filled triangle shows the position of HIP 63242 b. From Fig. 1 it is evident that there is a lack of close-in orbiting planets (a ≲ 0.6 AU) around giant stars2, whereas there are many short-period planets around MS stars. This observational result suggests that close-in planets are destroyed by the large envelope of the host star during the red giant phase. This idea was predicted theoretically to be caused by the strong tidal interaction between the planet and the stellar envelope. As a result, planets orbiting interior to a given distance spiral inward and are subsequently engulfed by the host star (e.g. Siess & Livio 1999; Sato et al. 2008; Villaver & Livio 2009; Kunitomo et al. 2011). However, the planetary population around subgiant stars shows a similar trend, i.e., a deficit of planets orbiting interior to ~0.6 AU. Since subgiant stars still have relatively small radii, the tidal effect is not expected to significantly affect the planetary orbits, meaning that stellar evolution cannot be solely responsible for this observational result (Johnson et al. 2007). In fact, Bowler et al. (2010) showed that the period distribution of planets around intermediate-mass stars (all of them detected around subgiants) is different than the population of planets around FGK dwarfs, at the 4σ level. In particular, they found that planets around intermediate-mass stars present systematically larger semi-major axis than planets orbiting low-mass stars. This result might in part explain the planet desert observed in Fig. 1, but does not explain the lack of planets around giant stars with ~1.0−1.5 M⊙ (which is also attributed to the target selection criteria in giant stars surveys).
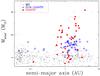 |
Fig. 1 Semi-major axis distribution for planets around evolved stars. The blue stars and red filled circles correspond to subgiant and giant host stars, respectively. The red triangle corresponds to HIP 63242 b. For comparison, planets around MS stars are also plotted (small black dots). |
In this paper we present the detection of a massive giant planet around HIP 63242, a nearby G8 giant star. Based on the best Keplerian fit, the minimum mass of HIP 63242 b is 9.2 MJ with an orbital period of 124.6 days, corresponding to a semi-major axis of a = 0.57 AU. This is the closest planet detected around a first ascending red giant branch (RGB) star, and the second closest around a giant star, after HIP 13044 (Setiawan et al. 2010).
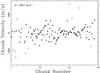 |
Fig. 2 Radial velocities computed to 144 different chunks, from a single observation of τ Ceti. The solid black dots are the chunk velocities, while the red crosses correspond to the rejected velocities. The standard deviation is 56.2 m s-1 , corresponding to an error in the mean velocity of 5.3 m s-1. |
2. Observations and data reduction
The data were obatained using FEROS (Kaufer et al. 1999), mounted on the 2.2 m telescope, at La Silla Observatory. The typical exposure time for the spectra was 210 seconds, leading to a signal-to-noise ratio (S/N) over 100. The FEROS spectra were extracted with the ESO Data Reduction System (DRS), which is available for FEROS users. The DRS performs bias substraction, flat-fielding, orders-tracing and extraction. In addition, the scattered light is substracted. The wavelength calibration was computed using two calibration lamps (one ThAr + one ThArNe, instead of the 12 standard calibrations) with different exposure times and intensities, which allows a coverage of the entire spectral range (~3500−9200 Å). The typical RMS in the wavelength solution is ~0.005 Å. Finally, the wavelength calibration was applied to the observed spectra, which were extracted order by order. Additionally, the reduction pipeline applies a barycentric correction to the extracted spectra, but this option was disabled because it retrieves the coordinates of the star that are recorded in the header, which are not accurate enough. Instead, this correction was computed separately, and was then applied to the reduced data, as discussed in the next section.
2.1. Radial velocity calculation
The RVs for each individual spectrum were measured in the following manner: Firstly, the Doppler shift was computed by applying a cross correlation (Tonry & Davis 1979) between the stellar spectrum and its corresponding template (high S/N spectrum of the same star). For this purpose we used the IRAF task RV/fxcor (Fitzpatrick 1993). This method was applied to ~50 Å chunks (corresponding to ~1700 pixels), leading to a total of 144 different RVs per observation. Then the mean velocity was computed for each dataset, rejecting in an iterative way every point lying more than 2.5 sigma from the mean, which typically correspond to 20% of them. It is worth mentioning that since all orders were included, cutting only 100 pixels at the edges, many chunks led to highly deviating velocities mainly either because of low S/N (specially toward the blue) or because of telluric lines (in the red part of the spectrum).
Figure 2 shows the chunk velocities from one spectrum of τ Ceti3. The black dots are the chunk velocities and the red crosses are those chunk RVs rejected by the procedure just described (some of them are beyond the plotted region). The standard deviation of the chunk velocities is 56.2 m s-1 , which corresponds to an error in the mean4 of just 5.3 m s-1. The second step consists of a similar procedure, but this time the cross-correlation is computed between the simultaneous calibration lamp (sky fiber) and one of the lamps that was used for the wavelength calibration of that night (i.e., corresponding to the night zero point), having a similar exposure time to the simultaneous calibration lamp. This procedure is neccessary to substract the nighlty drift, produced mainly by small variations in the refraction index of air in the spectrograph during the night, which at first order translates into a linear RV shift as large as ~150 m s-1s. No second order correction was applied, such as an RV shift between the two fibers, which is typically ~2−3 m s-1 (Setiawan et al. 2000). Finally, the radial velocity for each epoch was computed by:  (1)where the first and second terms correspond to the RV computed for the object with its corresponding template and to the nightly drift, as explained above. The third term corresponds to the barycentric correction, which was computed using the mean time of the observation and the actual coordinates of the star at that time, which are slightly different from those recorded in the image header (typically by up to ~1−2 arcmin). This is quite important, since the error in the header coordinates translates into an RV uncertainty as big as ~5−10 m s-1. Finally, we tested the long-term precision of FEROS using 52 spectra of τ Ceti, taken in 17 different nights (one spectrum was used as template) during the last three years. The resulting RV’s are shown in Fig. 3 (black dots). The measured RMS is 4.3 m s-1. In addition, we binned the RV datapoints for individual nights, in order to average out the main stellar oscillations modes5 (e.g. O’Toole et al. 2008). The binned RVs (red open circles) lead to an RMS of only 3.4 m s-1. This result shows the huge potential of FEROS for high-precision RV studies of bright stars.
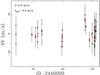 |
Fig. 3 Three years of observations of the RV standard star τ Ceti. The black dots correspond to the RVs measured from individual FEROS spectra. The RMS is 4.3 m s-1. The red open circles represent the binned RVs for individual nights. This time the RMS drops to 3.4 m s-1. |
3. HIP 63242 b: the closest planet around and intermediate-mass giant star
According to the Hipparcos catalog, HIP 63242 is a G8III star with V = 6.87, B − V = 1.03 and a parallax of π = 7.42 ± 0.49, which corresponds to a distance of 135 pc. As for the rest of the stars in our sample, we derived Teff, [Fe/H] and log g for HIP 63242, using the equivalent width of the iron lines (Fe i and Fe ii), by imposing excitation and ionization equilibrium. To do this we used the MOOG code6 (Sneden 1973) along with the Kurucz (1993) atmosphere models. For a more detailed description see Jones et al. (2011). Additionally, we computed the luminosity of HIP 63242 using the bolometric corrections given in Alonso et al. (1999) and the 3D extinction maps of Arenou et al. (1992). We compared the resulting Teff, [Fe/H] and stellar luminosity, which are listed in Table 1, with the Salasnich et al. (2000) evolutionary models. We derived a mass of 1.54 M⊙ for HIP 63242, using the linear interpolation method described in Jones et al. (2011). Figure 4 shows the position of HIP 63242 in the HR diagram and the closest evolutionary tracks from Salasnich et al. (2000) (upper panel). This star is clearly ascending the RGB, since there is no HB model crossing its position in the HR diagram. For comparison, Fig. 4 (lower panel) also shows two evolutionary iso-mass tracks taken from the Yonsei-Yale evolutionary models (Demarque et al. 2004) with solar-scaled metal abundances ([α/Fe] = 0.0). Both tracks were interpolated to [Fe/H] = −0.31, using the interpolator included with the evolutionary models7. As can be seen, the mass for HIP 63242 derived using the two sets of models is almost identical.
Stellar properties of HIP 63242.
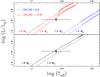 |
Fig. 4 Upper panel: position of HIP 63242 in the HR diagram. The four closest evolutionary tracks from Salasnich et al. (2000) are overplotted. Lower panel: same as for the upper panel, but this time using stellar tracks from the Yonsei-Yale database. Both models were interpolated to [Fe/H] = −0.31. |
During the last three years, 16 spectra (including the template) of HIP 63242 were taken with FEROS. Its RV curve is shown in Fig. 5. The resulting velocities are also listed in Table 3. The error bars are ~5−8 m s-1, therefore they are smaller than the symbol sizes. We used the Systemic Console (Meschiari et al. 2009) to compute the best Keplerian solution, which is shown by the solid black curve. As can be seen, there is a strong RV signal in the data. The orbital parameters of the planet are listed in Table 2. The RMS of the fit is 23.7 m s-1, which is mainly explained by stellar jitter. However, it is also possible that a second planet in the system produces a larger scatter from the single planet fit. Unfortunately, there are not enough observations yet to test this hypothesis.
Orbital parameters of HIP 63242 b.
Radial velocity measurements of HIP 63242.
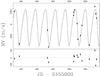 |
Fig. 5 Radial velocity curve for HIP 63242 (black dots). The best Keplerian fit is overplotted (black solid line). |
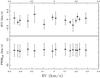 |
Fig. 6 Bisector velocity span (upper panel) and FWHM of the CCF (lower panel) against the RVs measured for HIP 63242. In both cases the CCFs were computed for 11 different orders, covering the wavelength range between ~5000−6000 Å. The error bars correspond to the uncertainty in the mean. |
4. Photometric and line profile analysis
Intrinsic stellar phenomena, such as spots, magnetic activity or stellar oscillations, are known to produce periodic RV signals that can mimic the Doppler shift induced by a substellar companion (e.g. Queloz et al. 2001; Huelamo et al. 2008; Figueira et al. 2010). We performed three standard tests aimed at determining whether this is the case for HIP 63242. First, we analyzed the Hipparcos photometric data, which consist of a total of 142 Hp filter observations, taken between JD 2447869 and 2449013. The photometric data show a low dispersion of 0.009 mag, which cannot be responsible for the observed RV variations. In fact, according Hatzes (2002), a spot covering 5% of the stellar surface (Δm ~ 0.06 mag) induces an RV variation below 100 m s-1 on a star with a projected rotational velocity similar to HIP 63242 (vrot = 3.6 km s-1). Moreover, no significant periodic signal is observed in the Hipparcos photometry. Hence, rotational modulation can be discarded as the responsible mechanism for the observed RV signal. We also performed a bisector analysis (Toner & Gray 1988), aimed at detecting asymmetries in the line profiles caused by intrinsic stellar phenomena. Figure 6 (upper panel) shows the observed RVs for HIP 63242 versus the bisector velocity span (BVS), which corresponds to the velocity difference between the bottom and the top of the CCF. We obtained an average BVS value from 11 different orders. Clearly, no obvious correlation between the two quantities is present. The width of the CCF as a function of the measured RVs is also plotted in the lower panel. Once again, there is no correlation between the two quantities. In both cases, the rms around the mean is comparable to the error bars. Finally, Fig. 7 shows the S-index variations, computed in a similar fashion as described in Jenkins et al. (2008; 2011), against the observed RVs. No correlation seems to be present. Based on these stellar activity diagnostics, we can conclude that the most likely explanation for the RV signal observed in HIP 63242 is a substellar companion.
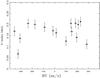 |
Fig. 7 S-index variation as described in Jenkins et al. (2008, 2011) against the measured RVs for HIP 63242. |
5. Summary and conclusions
We computed precision RVs using FEROS spectra of the giant star HIP 63242, which have revealed a strong periodic signal. We developed a RV computation method that leads to a long-term RV precision of ~3−4 m s-1, which is much better than was previously obtained with FEROS data. To determine whether these variations are related to intrinsic stellar phenomena (rotational modulation, stellar pulsation or magnetic-related activity), we performed a detailed photometric, line profiles and Ca II lines emission analysis. We found no correlation with the RV variations, meaning that the observed RV signal is probably to be attributed to an extrinsic mechanism.
According to the best Keplerian fit and assuming a mass for the host star of 1.54 M⊙, we derived a semi-major axis of 0.57 AU for HIP 63242 b, which corresponds to the innermost planet yet detected around a RGB stars. The detection of these type of planets is very important because they allow us to better understand the effect of the stellar evolution (after the MS) on the orbital properties of planets. In addition, even though close-in planets around intermediate-mass stars are rare, more of them can be expected to be detected in the coming years, allowing us to distinguish the effect of the stellar mass from the stellar evolution in their orbits.
Source: http://exoplanet.eu
There is only one known planet around giant stars interior to 0.6 AU. The planet is in a 16.2-day-period orbit around a 0.8 M⊙ horizontal branch star (Setiawan et al. 2010). However, there is no available parallax for the host star, and thus its mass and evolutionary status are quite uncertain.
τ Ceti is a kwown stable star at the few m s-1 level. However, Tuomi et al. (2013), have shown that it hosts a planetary system.
The error in the mean is given by σ/ , where σ is the standard deviation of the chunks velocities and nc is the number of non-rejected chunks used in the analysis
The typical exposure time of the τ Ceti spectra is ~10−30 s.
Acknowledgments
We acknowledge the referee, John A. Johnson for his very useful comments. M.J. and P.R. acknowledge financial support from Fondecyt through grant #1120299. M.J. also acknowledges financial support from ALMA-Conicyt grant #31080027 and from BASAL PFB-06. J.J. acknowledges funding by Fondecyt through grant 3110004 and partial support from BASAL PFB-06, the GEMINI-CONICYT FUND and from the Comité Mixto ESO-GOBIERNO DE CHILE.
References
- Alonso, A., Arribas, S., & Martinez-Roger, C. 1999, A&A, 140, 261 [Google Scholar]
- Arenou, F., Grenon, M., & Gómez, A. 1992, A&A, 258, 104 [NASA ADS] [Google Scholar]
- Barnes, J. R., Jenkins, J. S., Jones, H. R. A., et al. 2012, MNRAS, 424, 591 [NASA ADS] [CrossRef] [Google Scholar]
- Bowler, B. P., Johnson, J. A., Marcy, G. W., et al. 2010, ApJ, 709, 396 [NASA ADS] [CrossRef] [Google Scholar]
- Demarque, P., Woo, J., Kim, Y., & Yi, S. K. 2004, ApJS, 155, 667 [NASA ADS] [CrossRef] [Google Scholar]
- Figueira, P., Marmier, M., Bonfils, X., et al. 2010, A&A, 513, A8 [NASA ADS] [CrossRef] [EDP Sciences] [Google Scholar]
- Fitzpatrick, M. J. 1993, ASPC, 52, 472 [NASA ADS] [Google Scholar]
- Hekker, S., Reffert, S., Quirrenbach, A., et al. 2006, A&A, 454, 943 [NASA ADS] [CrossRef] [EDP Sciences] [Google Scholar]
- Huélamo, N., Figueira, P., Bonfils, X., et al. 2008, A&A, 489, 9 [Google Scholar]
- Jenkins, J. S., Jones, H. R. A., Pavlenko, Y., et al. 2008, A&A, 485, 571 [NASA ADS] [CrossRef] [EDP Sciences] [Google Scholar]
- Jenkins, J. S., Ramsey, L. W., Jones, H. R. A., et al. 2009, ApJ, 704, 975 [NASA ADS] [CrossRef] [Google Scholar]
- Jenkins, J. S., Murgas, F., Rojo, P., et al. 2011, A&A, 531, A8 [NASA ADS] [CrossRef] [EDP Sciences] [Google Scholar]
- Jenkins, J. S., Jones, H. R. A., Tuomi, M., et al. 2013, ApJ, 766, 67 [NASA ADS] [CrossRef] [Google Scholar]
- Johnson, J. A., Fischer, D. A., Marcy, G. W., et al. 2007, ApJ, 665, 785 [NASA ADS] [CrossRef] [Google Scholar]
- Jones, M. I., Jenkins, J. S., Rojo, P., & Melo, C. H. F. 2011, A&A, 536, A71 [NASA ADS] [CrossRef] [EDP Sciences] [Google Scholar]
- Kaufer, A., Stahl, O., Tubbesing, S., et al. 1999, The Messenger 95, 8 [Google Scholar]
- Kunitomo, M., Ikoma, M., Sato, B., et al. 2011, ApJ, 737, 66 [NASA ADS] [CrossRef] [Google Scholar]
- Kurucz, R. L. 1993, ATLAS9 Stellar Atmosphere Programs and 2 km s-1 Grid, CD-ROM No. 13 (Smithsonian Astrophysical Observatory, Cambridge) [Google Scholar]
- Meschiari, S., Wolf, A. S., Rivera, E., et al. 2009, PASJ, 121, 1016 [Google Scholar]
- O’Toole, S. J., Tinney, C. G., & Jones, H. R. A. 2008, MNRAS, 386, 516 [NASA ADS] [CrossRef] [Google Scholar]
- Queloz, D., Henry, G. W., Sivan, J. P., et al. 2001, A&A, 379, 279 [NASA ADS] [CrossRef] [EDP Sciences] [Google Scholar]
- Rutten, R. G. M., & Pylyser, E. 1988, A&A, 191, 227 [NASA ADS] [Google Scholar]
- Salasnich, B., Girardi, L., Weiss, A., & Chiosi, C. 2000, A&A, 361, 1023 [NASA ADS] [Google Scholar]
- Sato, B., Kambe, E., Takeda, Y., et al. 2005, PASJ, 57, 97 [NASA ADS] [CrossRef] [Google Scholar]
- Sato, B., Izumiura, H., Toyota, E., et al. 2008, PASJ, 60, 539 [NASA ADS] [Google Scholar]
- Schrijver, C. J., & Pols, O. R. 1993, A&A, 278, 51 [Google Scholar]
- Setiawan, J., Klement, R. J., Henning, T., et al. 2010, Science, 330, 1642 [NASA ADS] [CrossRef] [Google Scholar]
- Siess, L., & Livio, M. 1999, MNRAS, 308, 1133 [NASA ADS] [CrossRef] [Google Scholar]
- Sneden, C. 1973, ApJ, 184, 839 [NASA ADS] [CrossRef] [Google Scholar]
- Tonry, J., & Davis, M. 1979, AJ, 84, 1511 [NASA ADS] [CrossRef] [Google Scholar]
- Tuomi, M., Jones, H. R. A., Jenkins, J. S., et al. 2013, A&A, 551, A79 [NASA ADS] [CrossRef] [EDP Sciences] [Google Scholar]
- Villaver, E., & Livio, M. 2009, ApJ, 705, 81 [Google Scholar]
All Tables
All Figures
|
Fig. 1 Semi-major axis distribution for planets around evolved stars. The blue stars and red filled circles correspond to subgiant and giant host stars, respectively. The red triangle corresponds to HIP 63242 b. For comparison, planets around MS stars are also plotted (small black dots). |
| In the text | |
|
Fig. 2 Radial velocities computed to 144 different chunks, from a single observation of τ Ceti. The solid black dots are the chunk velocities, while the red crosses correspond to the rejected velocities. The standard deviation is 56.2 m s-1 , corresponding to an error in the mean velocity of 5.3 m s-1. |
| In the text | |
|
Fig. 3 Three years of observations of the RV standard star τ Ceti. The black dots correspond to the RVs measured from individual FEROS spectra. The RMS is 4.3 m s-1. The red open circles represent the binned RVs for individual nights. This time the RMS drops to 3.4 m s-1. |
| In the text | |
|
Fig. 4 Upper panel: position of HIP 63242 in the HR diagram. The four closest evolutionary tracks from Salasnich et al. (2000) are overplotted. Lower panel: same as for the upper panel, but this time using stellar tracks from the Yonsei-Yale database. Both models were interpolated to [Fe/H] = −0.31. |
| In the text | |
|
Fig. 5 Radial velocity curve for HIP 63242 (black dots). The best Keplerian fit is overplotted (black solid line). |
| In the text | |
|
Fig. 6 Bisector velocity span (upper panel) and FWHM of the CCF (lower panel) against the RVs measured for HIP 63242. In both cases the CCFs were computed for 11 different orders, covering the wavelength range between ~5000−6000 Å. The error bars correspond to the uncertainty in the mean. |
| In the text | |
|
Fig. 7 S-index variation as described in Jenkins et al. (2008, 2011) against the measured RVs for HIP 63242. |
| In the text | |
Current usage metrics show cumulative count of Article Views (full-text article views including HTML views, PDF and ePub downloads, according to the available data) and Abstracts Views on Vision4Press platform.
Data correspond to usage on the plateform after 2015. The current usage metrics is available 48-96 hours after online publication and is updated daily on week days.
Initial download of the metrics may take a while.