Free Access
Fig. 4
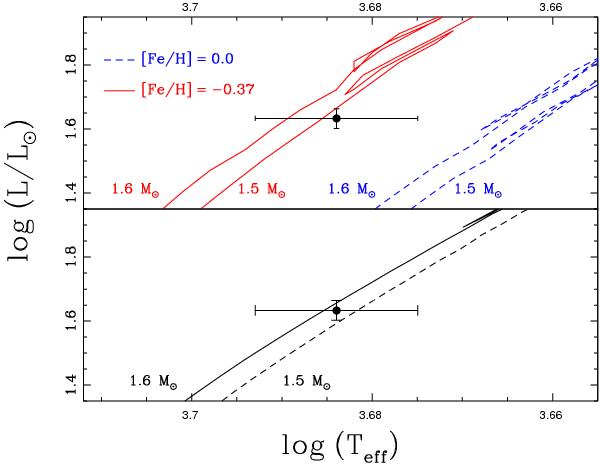
Upper panel: position of HIP 63242 in the HR diagram. The four closest evolutionary tracks from Salasnich et al. (2000) are overplotted. Lower panel: same as for the upper panel, but this time using stellar tracks from the Yonsei-Yale database. Both models were interpolated to [Fe/H] = −0.31.
Current usage metrics show cumulative count of Article Views (full-text article views including HTML views, PDF and ePub downloads, according to the available data) and Abstracts Views on Vision4Press platform.
Data correspond to usage on the plateform after 2015. The current usage metrics is available 48-96 hours after online publication and is updated daily on week days.
Initial download of the metrics may take a while.