Free Access
Fig. 2
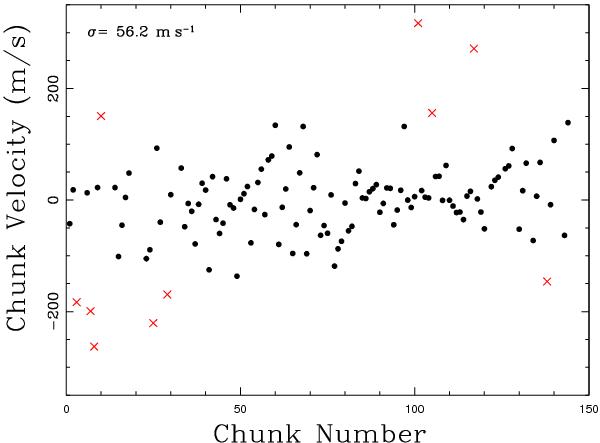
Radial velocities computed to 144 different chunks, from a single observation of τ Ceti. The solid black dots are the chunk velocities, while the red crosses correspond to the rejected velocities. The standard deviation is 56.2 m s-1 , corresponding to an error in the mean velocity of 5.3 m s-1.
Current usage metrics show cumulative count of Article Views (full-text article views including HTML views, PDF and ePub downloads, according to the available data) and Abstracts Views on Vision4Press platform.
Data correspond to usage on the plateform after 2015. The current usage metrics is available 48-96 hours after online publication and is updated daily on week days.
Initial download of the metrics may take a while.