Free Access
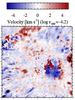
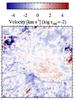
Fig. 7
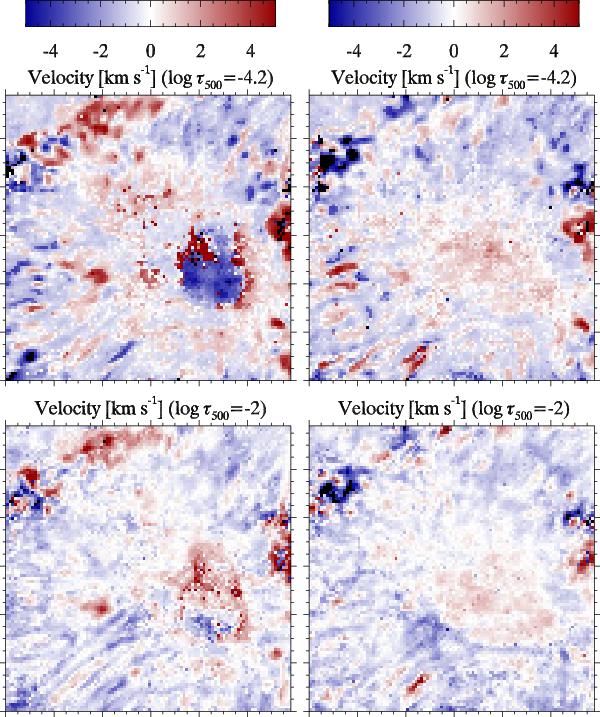
l.o.s. velocity component from a non-LTE inversion. Slices at constant optical depth are shown in two columns at quiescent (right) and flash (left) phases at log τ500 = −4.2, − 2 respectively from top to bottom. Negative velocities correspond to upflows. The minor tick-mark separation is  .
.
This figure is made of several images, please see below:
Current usage metrics show cumulative count of Article Views (full-text article views including HTML views, PDF and ePub downloads, according to the available data) and Abstracts Views on Vision4Press platform.
Data correspond to usage on the plateform after 2015. The current usage metrics is available 48-96 hours after online publication and is updated daily on week days.
Initial download of the metrics may take a while.