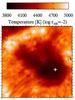
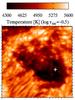
Fig. 6
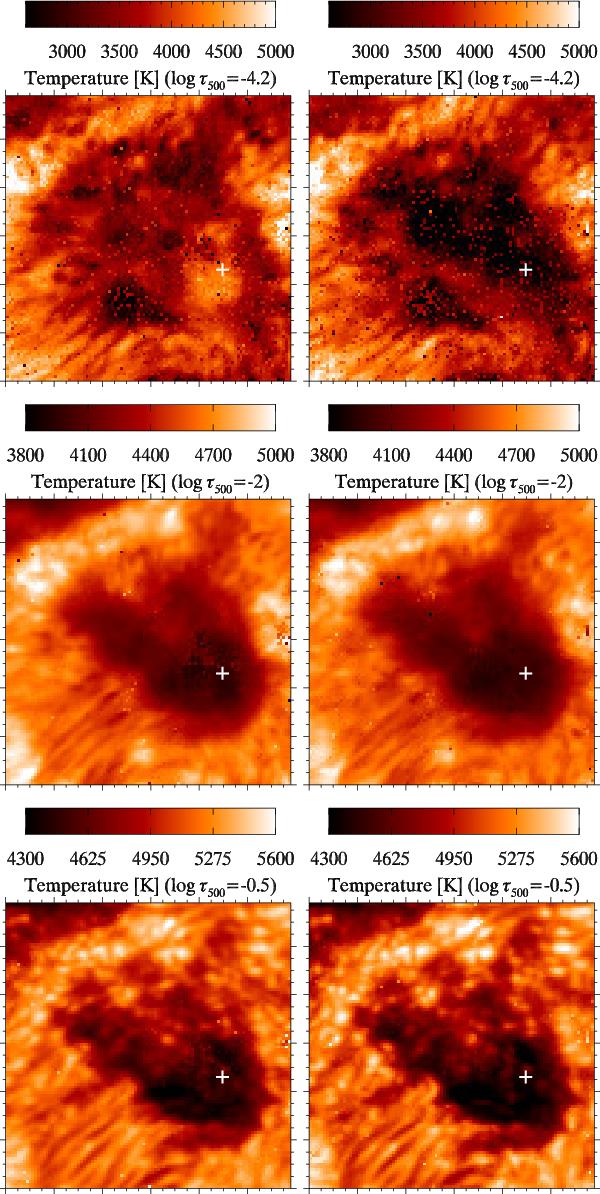
Inferred temperature from a non-LTE inversion. Temperature slices from the inversion are shown in two columns at quiescent (right) and flash (left) phases at several optical-depth log τ500 = −4.2, − 2, − 0.5 respectively from top to bottom. Note that we have performed a depth average of 0.5 dex, centered at those heights. The minor tick-mark separation is  . The white cross marks the center of the patch of which the temperature and velocity stratifications are shown in Fig. 5

Current usage metrics show cumulative count of Article Views (full-text article views including HTML views, PDF and ePub downloads, according to the available data) and Abstracts Views on Vision4Press platform.
Data correspond to usage on the plateform after 2015. The current usage metrics is available 48-96 hours after online publication and is updated daily on week days.
Initial download of the metrics may take a while.