Fig. 5
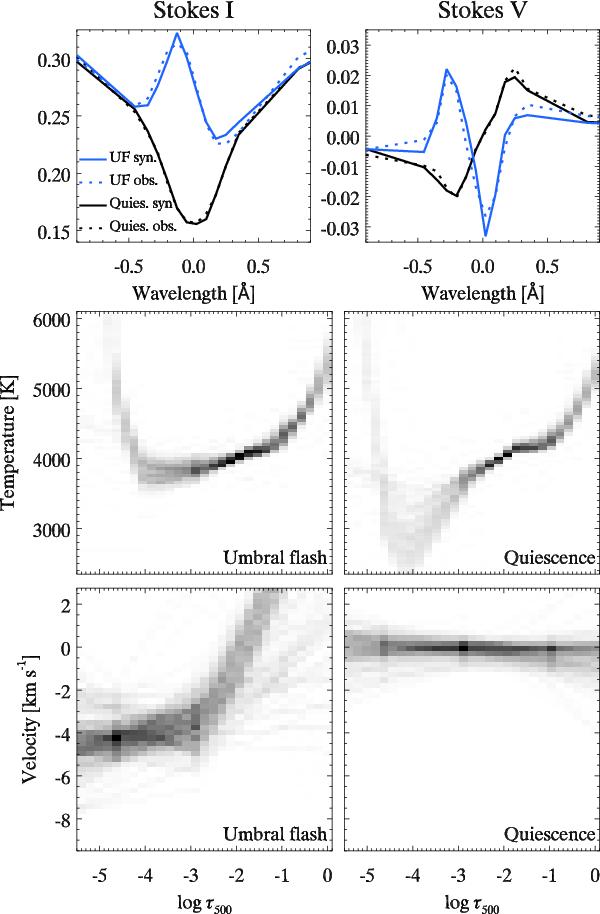
Top row: observed (dashed line) and inverted (solid line) profiles from one pixel within the sunspot during the UF phase (blue) and quiescence (black). Middle row: density map illustrating the inferred temperature stratification during UF (left) and quiescence (right) for a patch inside the umbra. A total of 280 models is shown. Bottom row: same as middle row, for the l.o.s velocity stratification. Negative velocities correspond to upflows.
Current usage metrics show cumulative count of Article Views (full-text article views including HTML views, PDF and ePub downloads, according to the available data) and Abstracts Views on Vision4Press platform.
Data correspond to usage on the plateform after 2015. The current usage metrics is available 48-96 hours after online publication and is updated daily on week days.
Initial download of the metrics may take a while.