Fig. 4
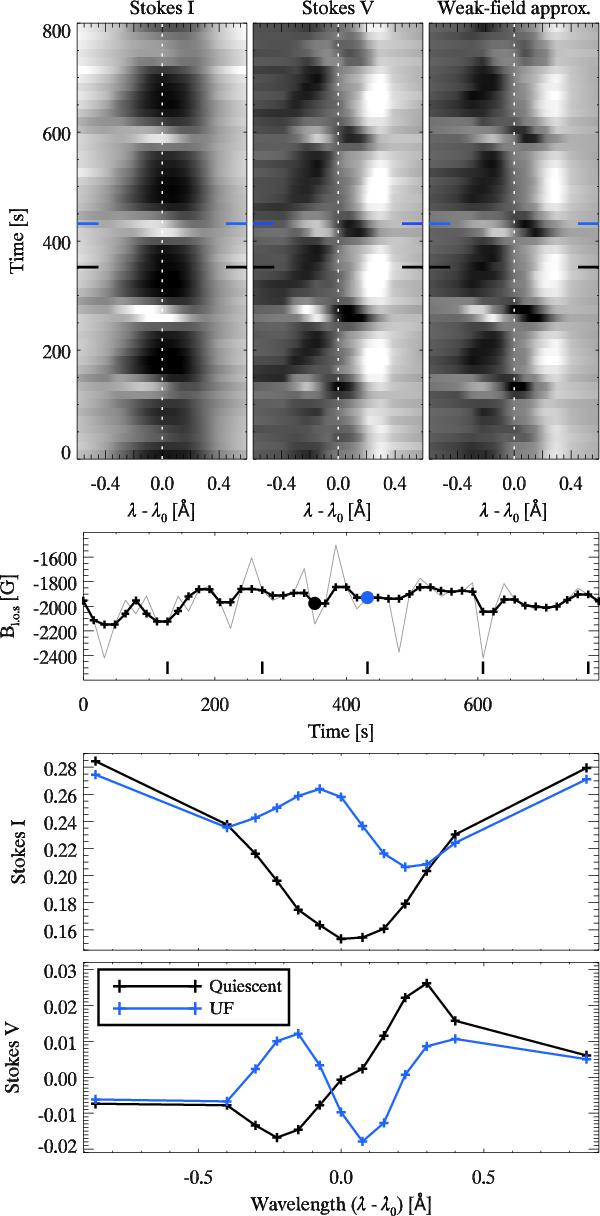
Time-series at a single pixel within the sunspot is shown in the top three-panels, in Stokes I (top left) and V (top middle). The top-right panel corresponds to a synthetic Stokes V profile computed using the weak-field approximation to fit Bl.o.s. In both cases, the Stokes V profiles are scaled identically between ± 2.2% relative to the average quiet-Sun continuum intensity. The resulting longitudinal magnetic field strenght is plotted in the second row (solid-grey line). We have smoothed that result using a median filter of 3 time-steps, which is illustrated with a black-crossed line. For clarity, the lowermost panels illustrate the Stokes I and V profiles at a quiescent state (black) and during the UF (blue).
Current usage metrics show cumulative count of Article Views (full-text article views including HTML views, PDF and ePub downloads, according to the available data) and Abstracts Views on Vision4Press platform.
Data correspond to usage on the plateform after 2015. The current usage metrics is available 48-96 hours after online publication and is updated daily on week days.
Initial download of the metrics may take a while.