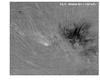
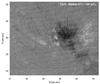
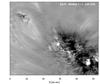
Fig. 2
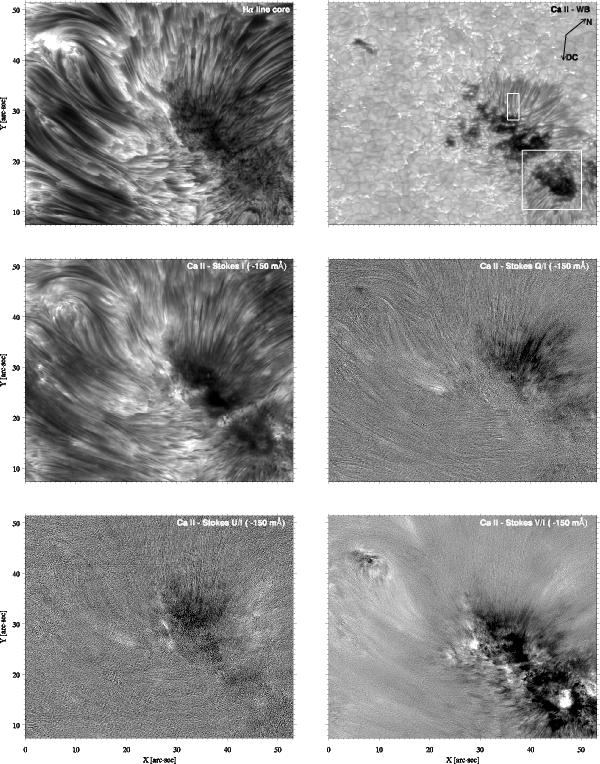
CRISP filtergrams at the core of the Hα line (top left). All other images are in Ca iiλ8542. A wide-band image showing the photosphere is displayed in the top right panel. The lowermost four panels show the chromosphere at Δλ = −150 mÅ from line core in Stokes I (middle left), Q/I (middle right), U/I (bottom left) and V/I (bottom right). The arrows on the wide-band image indicate the direction to the solar North and to disk center, respectively. The largest white box indicated in the wide-band image highlights the subfield that has been used for the non-LTE inversions, whereas the smaller square indicates a subfield used to study running penumbral waves.
Current usage metrics show cumulative count of Article Views (full-text article views including HTML views, PDF and ePub downloads, according to the available data) and Abstracts Views on Vision4Press platform.
Data correspond to usage on the plateform after 2015. The current usage metrics is available 48-96 hours after online publication and is updated daily on week days.
Initial download of the metrics may take a while.