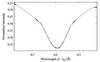
Fig. A.1
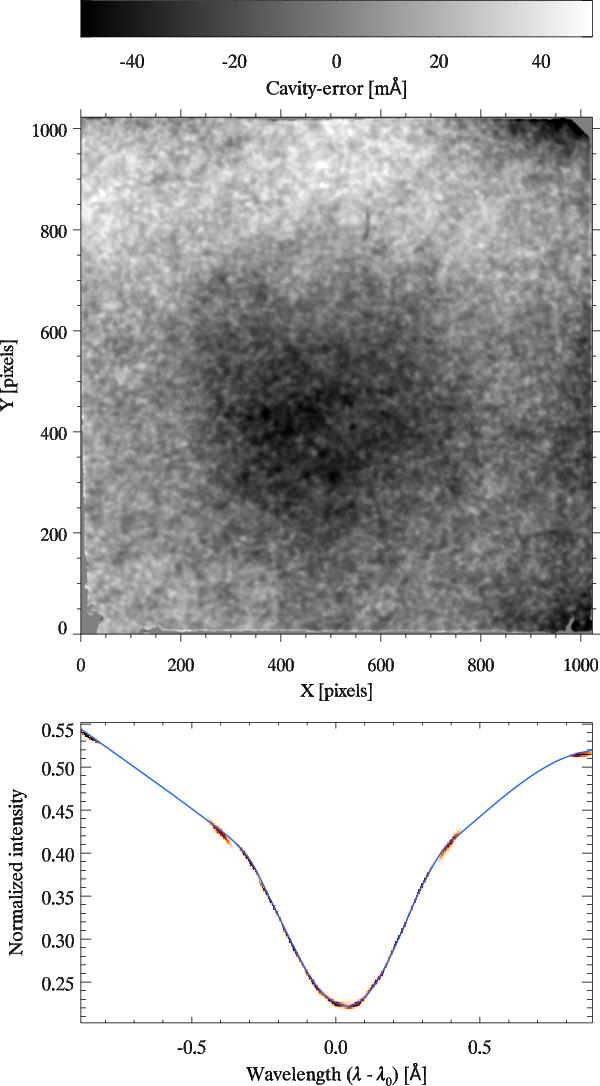
Top: map of the FPI cavity errors in units of wavelength shift. Bottom: density plot of all pixels in the summed flat-field data (orange clouds) that have been shifted to the correct wavelength and corrected for the different contributions in the model. The blue line is the average line profile described by a spline curve and closely resembles a disk center quiet Sun atlas profile.
Current usage metrics show cumulative count of Article Views (full-text article views including HTML views, PDF and ePub downloads, according to the available data) and Abstracts Views on Vision4Press platform.
Data correspond to usage on the plateform after 2015. The current usage metrics is available 48-96 hours after online publication and is updated daily on week days.
Initial download of the metrics may take a while.