Fig. 11
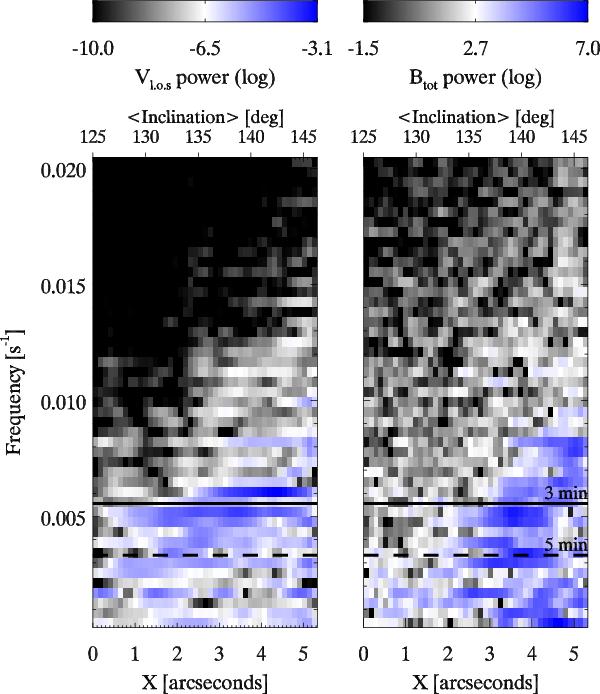
FFT power spectra along each column for the l.o.s velocities and magnetic field strength presented in Fig. 10. The axis labeling at the top indicates the average magnetic field inclination obtained through averaging over the right panel of Fig. 10. More inclined field is found in the outer penumbra (x = 0), more vertical field in the umbra (right side of the panels). The solid horizontal line indicates the 3 min mode, whereas the horizontal dashed line indicates the 5 min mode.
Current usage metrics show cumulative count of Article Views (full-text article views including HTML views, PDF and ePub downloads, according to the available data) and Abstracts Views on Vision4Press platform.
Data correspond to usage on the plateform after 2015. The current usage metrics is available 48-96 hours after online publication and is updated daily on week days.
Initial download of the metrics may take a while.