Fig. 10
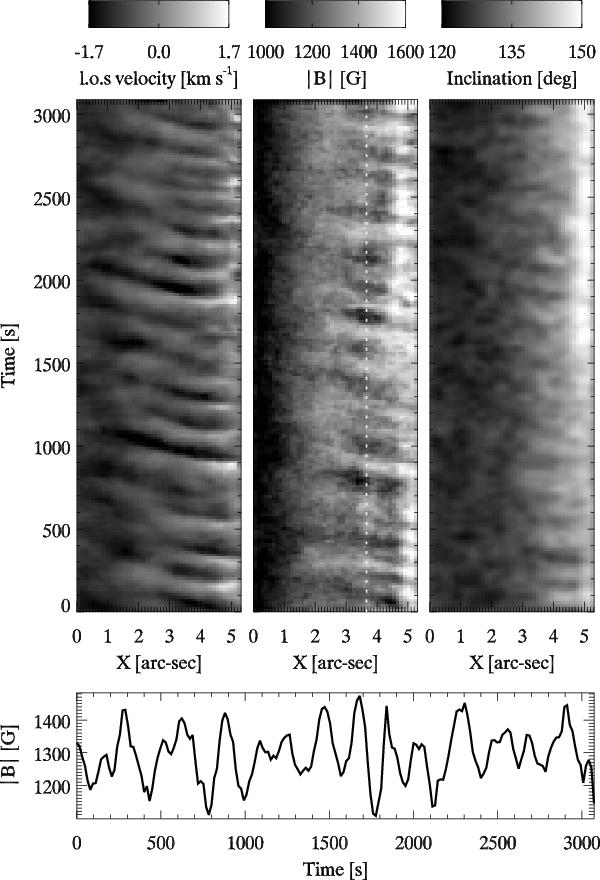
x-t diagrams for the l.o.s velocity (left), the magnetic field strength (middle) and the magnetic field inclination (right) are shown in the top row. The umbra is on the right side of the panels, the outer penumbra on the left side (x = 0). The detailed magnetic field strength modulation for one spatial location (at x = 3.65, indicated with the white dotted line in the middle panel) is plotted in the bottom panel. The magnetic field inclination has been smoothed with a 3 pixels full-width-half-maximum Gaussian kernel.
Current usage metrics show cumulative count of Article Views (full-text article views including HTML views, PDF and ePub downloads, according to the available data) and Abstracts Views on Vision4Press platform.
Data correspond to usage on the plateform after 2015. The current usage metrics is available 48-96 hours after online publication and is updated daily on week days.
Initial download of the metrics may take a while.