| Issue |
A&A
Volume 556, August 2013
|
|
|---|---|---|
| Article Number | A85 | |
| Number of page(s) | 9 | |
| Section | Stellar structure and evolution | |
| DOI | https://doi.org/10.1051/0004-6361/201321358 | |
| Published online | 01 August 2013 | |
XMM-Newton observations of RR Telescopii: evidence for wind signatures and shocked gas emission
1
XMM-Newton Science Operations Centre,
ESAC, 28691
Madrid,
Spain
e-mail: This email address is being protected from spambots. You need JavaScript enabled to view it.
2
INAF – Osservatorio Astronomico di Trieste,
34143
Trieste,
Italy
3
Departamento de Física Teórica, Universidad Autónoma de
Madrid, 28049
Madrid,
Spain
4
INAF – IAPS, Via del Fosso del Cavaliere
100, Rome, Italy
Received: 25 February 2013
Accepted: 14 June 2013
Abstract
RR Telescopii is the prototype of the symbiotic novae class. Since its outburst in 1944, it has been slowly fading, and its emission-line spectrum has evolved significantly. In this paper we discuss XMM-Newton observations of RR Tel taken in April 2009. These are the first X-ray high-resolution spectra of this system, and they provide important information about the physical conditions of the emitting gas. We have estimated the temperature and the luminosity of the hot star to be 154 kK and 5000 L⊙, respectively, from the comparison of model atmospheres with the X-ray spectra. Normalisation of the models with the far ultraviolet flux leads to similar values. Both the shape of the low-resolution X-ray spectrum and the spectral diagnostics that make use of the emission lines present in the RGS spectrum indicate the existence of collisionally ionised gas. At least two components are present, with temperatures of ≈0.6 and 1.7 MK. The existence of a wind from the hot star is unequivocally confirmed by HST-STIS observations taken in 2000, which showed displaced absorption components for the N V 1240 Å and C IV 1550 Å doublets. These components have terminal velocities of the order of 400 km s-1, which is consistent with the temperature of the gas detected in X-rays.
Key words: binaries: symbiotic / X-rays: binaries / stars: individual: RR Telescopii
© ESO, 2013
1. Introduction
RR Telescopii is one of the best-studied symbiotic stars. It is the prototype of the symbiotic novae class and, within this group, is the one showing the slowest evolution. Its outburst started in October 1944, when its visual magnitude was ≈14, and reached its maximum brightness at magnitude 7 more than one year later. It stayed at maximum during five years and then started to turn down. Nearly 70 years after the outburst, the system is still declining and is currently at visual magnitude ≈12 (from AAVSO lightcurve).
Already before the 1944 outburst, RR Tel was known to be a Mira variable (spectral type M5 III) with a period of 387 days. Based on this period, Whitelock (1988) estimated a distance to RR Tel of 2.6 kpc. This is the value commonly adopted. Nevertheless, there are indications that the absorption could have been overestimated in the past. Selvelli et al. (2007) used the intensity ratios of the He II Fowler lines to derive the extinction, obtaining a value of E(B − V) ≈ 0.00, while values previously adopted were in the range 0.08−0.10. This low reddening would place the system at a distance of 3.5 kpc.
The binary nature of RR Tel and the presence of a hot white dwarf in the system were established from the first International Ultraviolet Explorer (IUE) observations in the late ’70s (Selvelli et al. 1979). This hot star ionised the extended envelope of the Mira, giving rise to a large number of emission lines in the optical and ultraviolet (UV) ranges. The orbital period of the system and the distance between the two stars both remain unknown at present.
The optical and UV spectrum of the system is extraordinarily rich, with emission lines spanning a wide range in ionisation and excitation, and has undergone remarkable changes over the years. Examples can be seen in Selvelli & Bonifacio (2000) and Selvelli et al. (2007). Penston et al. (1983) made a thorough study of the IUE spectrum of RR Tel, where they identified more than 400 emission lines in the UV range. Harper et al. (1999) used HST Goddard High Resolution Spectrograph (GHRS) spectra to provide constraints to atomic data for O IV. More recently, using Space Telescope Imaging Spectrograph (STIS) and ESO Ultraviolet and Visual Echelle Spectrograph (UVES) spectra, Young et al. (2011) derived wavelengths for a large set of forbidden and intercombination lines, and Young (2012) identified up to nineteen O VI recombination lines.
Einstein and EXOSAT made the first detection of RR Tel in X-rays. Kwok & Lehay (1984) interpreted the Einstein observations as bremstrahlung emission from a gas with a temperature of 5 MK. The mechanism responsible for this high-temperature gas was ascribed to wind-wind interaction, i.e. the collision and consequent shock between the fast wind of the nova and the slow wind of the M5 III star.
The ROSAT observation of RR Tel obtained in 1992 was analysed in detail by Jordan et al. (1994). The PSPC spectrum is dominated by a super-soft component. A fit to model atmospheres gave an effective temperature of 142 kK and a luminosity of 3500 L⊙. These authors describe the presence of a harder, much weaker component, which is too faint to make a detailed analysis; they also speculated that it could be originated in shocks between the winds of the two stars.
Swift observations taken in 2007 confirmed the presence of the soft component at a flux level similar to that detected by ROSAT 15 years before (Ness et al. 2007).
In this paper we describe the observations of RR Tel obtained in 2009 with XMM-Newton. A preliminary analysis of these data was presented in González-Riestra et al. (2012). We now complement these observations with STIS spectra taken in 2000.
Summary of XMM-Newton X-ray observations of RR Tel.
2. XMM observations and data reduction
RR Tel was observed in April 2009 (obsid 05511501) by all the instruments on-board XMM-Newton, including the Optical Monitor (OM). Details of the exposures taken with the X-ray instruments are summarised in Table 1, and a similar summary for OM is found in Table 3.
The XMM-Newton data have been reduced with the most recent version of the Science Analysis System (SAS 12.1) and with the most up-to-date calibration data as of September 2012. The observations were partly affected by background flares. These periods of high radiation were removed before analysing the data. Spectra from the EPIC-MOS cameras were extracted from a circular region of about 40 arcsec of radius around the target. For the three cameras, the background was extracted from a closeby circular region. The distribution of event patterns in the EPIC-pn data was found to be substantially different from the expected one, and the core of the point spread function was excised to minimise the effect of pile-up in the spectral analysis. The RGS and OM data were processed in a standard way. We discuss EPIC data in Sect. 3, RGS spectra in Sect. 4, and OM observations in Sect. 5.
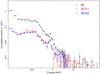 |
Fig. 1 XMM-Newton EPIC spectra of RR Tel. For clarity, the spectra shown here have been rebinned in order to oversample the full width half maximum of the energy resolution by a factor 3 and to have a minimum of ten counts per bin. |
3. The XMM-Newton EPIC spectra
Table 1 gives the observed count rates in the three EPIC cameras in the range 0.2−2.0 keV. The spectra are shown in Fig. 1.
We attempted to model the XMM-Newton EPIC data with XSPEC. The fit was performed on spectra rebinned in order to oversample the full width half maximum of the energy resolution by a factor 3 and to have a minimum of 25 counts per bin. In addition, the spectral range was restricted to 0.2−2 keV for the three cameras, as the signal is extremely low at higher energies.
To account for the emission of the hot star, we used the non-local thermodynamic equilibrium (NLTE) stellar atmosphere models for hot stars described by Rauch (2003)1. This web provides grids of NLTE stellar model fluxes for hot stars with temperatures between 50 and 190 kK and surface gravities in the range log g = 5−9. In this case we have selected models with solar abundance and log g = 6.
The flux excess observed above ≈0.4 keV (see Fig. 2) indicates clearly that, in addition to stellar emission, a contribution from gas emission is present that should be suitably taken into account.
Nevertheless, we found that a single-temperature gas cannot reproduce the overall continuum shape of the spectrum. We then used a model with three components: the aforementioned atmosphere models, and two MEKAL plasmas which have different temperatures and are affected by different amounts of absorption (Fig. 2).
The derivation of accurate parameters from the atmosphere models is made more difficult by the limited response of the EPIC camera in the soft energy range. For this reason we had to constrain some of the parameters of the fit beforehand. In first place, based on the values of the colour excess E(B − V) as derived from various authors (see Table 4), we could set an upper limit to the hydrogen column density of 6 × 1020 cm-2. Based on the values presented in the same table, the lower limit to the effective temperature of the hot star was set to 130 kK.
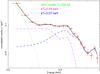 |
Fig. 2 Detail of XMM-Newton EPIC-pn spectrum of RR Tel showing the fit to the atmosphere model and the two MEKAL plasmas. Though the fit has been performed using the data from the three EPIC cameras, only EPIC-pn is shown for clarity. |
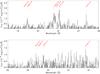 |
Fig. 3 RGS fluxed spectrum of RR Tel. This spectrum is a combination of RGS1 and RGS2 data. The labels mark the strongest lines. |
The best-fit value of the temperature of the hot star is 154 kK, which implies (assuming a distance of 2.6 kpc) a luminosity of 5000 L⊙. The best-fit column density is 2.8 × 1020 cm-2 (equivalent to E(B − V) = 0.047 for a standard gas-to-dust ratio of 6 × 1021 cm-2 mag-1 (Bohlin et al. 1978)). We recall that Jordan et al. (1994) obtained values of NH in the range 1.7−3.1 × 1020 cm-2 from ROSAT PSPC observations.
The temperatures of the two plasmas are 0.04 and 0.07 keV (≈0.5 and 0.8 MK). The first one is the main contributor below 0.4 keV. The second one is required to reproduce the peaks around 0.6 and 0.9 keV, which correspond to the He-like triplets of O VII and Ne IX (see Fig. 2). These two plasmas are affected by additional absorption, with hydrogen columns densities of 1.7 and 6.4 × 1021 cm-2, respectively, both at least ten times higher than the interstellar column density. The emission measure of the two plasmas is 2 × 1059 and 5 × 1058 cm3, respectively, for a distance of 2.6 kpc, and their luminosities, correcting only for interstellar absorption, are 0.04 and 0.02 L⊙, respectively, in agreement with the estimation made by Jordan et al. (1994). Taking into account the absorption that affects each of the components, their intrinsic luminosities in the range 0.2−10 keV are approximately 20 and 70 L⊙, respectively.
Emission lines in the RGS spectrum of RR Tel.
Summary of XMM-Newton OM observations of RR Tel.
4. The RGS spectrum
The RGS spectrum of RR Tel is weak, with a count rate of 0.004−0.003 cts s-1 for RGS1 and RGS2, respectively. The difference in count rate between the two instruments reflects the fact that the main contributor to the overall flux is the O VII He-like triplet, which only appears in RGS1. No continuum flux is detected. The model derived from the EPIC data described above predicts a flux at 20 Å of ≈1 × 10-15 erg cm-2 s-1 Å-1, equivalent to 6 × 10⁻⁵ RGS cts s-1 Å-1, which is in good agreement with the observed 3σ upper limit of 5 × 10⁻³ cts s-1 Å-1. The strongest lines present in the spectrum, apart from the O VII triplet, are the Lyman α lines of O VIII, N VII, and C VI, along with the N VI triplet (Fig. 3). Their wavelengths and intensities, the latter obtained through a fit with XSPEC, are given in Table 2. Due to the low number of counts per bin, the C-statistic has been used for the fits. The background has not been subtracted but modelled together with the lines, which have been assumed to be Gaussian functions. None of the lines shows evidence for intrinsic broadening.
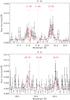 |
Fig. 4 O VII (RGS1) and N VI (RGS2) He-like multiplets in RR Tel. The spectra have been binned to a minimum of three counts per bin. The red line shows the best-fit model for the resonance and forbidden lines. The intercombination line is shown with its intensity set to the upper obtained from the fit. Dips due to bad columns are clearly seen near 21.6 and 21.8 Å. The blue line in the top panel shows the analytical representation of the three Gaussians, broadened with the instrumental width (≈0.07 Å FWHM) and having the intensities derived in the fit. |
The He-like triplets are a powerful tool for the diagnostics of the ionisation processes in the plasma (see Porquet & Dubau 2000; Porquet et al. 2001, 2010). The “R” ratio (ratio of the intensities of the forbidden and the intercombination lines) is sensitive to the electron density, and the “G” ratio (ratio of the intensities of the forbidden plus the intercombination lines and the resonance line) is sensitive to the electron temperature. In a purely photoionised plasma, the value of G is always larger than four. A strong resonance line (i.e. a low value of G) is indicative of the importance of collisional processes. A low value of R indicates a high electron density.
The intensity of the resonance line in the two He-like triplets detected in the RGS spectrum of RR Tel is comparable to that of the forbidden line (Fig. 4). This is a clear indication of the importance of collisional processes in the plasma (Porquet et al. 2010). On the other hand, the intercombination line is extremely faint in both cases, so that only an upper limit to its intensity can be given.
Determinations of temperature and radius of RR Tel.
The value of the G parameter is ≈1.0 for the O VII triplet, and 1.2 for the N VI triplet. Using the latest version of the CHIANTI database (v7.0, Landi et al. 2012), the corresponding electron temperatures are 1.4 × 10⁶ K for O VII and 5.0 × 10⁵ K for N VI. The temperatures at maximum ionisation ratio for both ions are 9 × 10⁵ K and 6 × 10⁵ K. These two temperatures are in good agreement with those derived from the fit to the EPIC spectra.
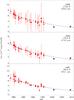 |
Fig. 5 Evolution of the UV flux of RR Tel. Triangles are fluxes in the XMM-Newton OM bands computed from IUE spectra. Filled circles are fluxes measured by the XMM-Newton OM. Squares and diamonds are points derived from the STIS spectrum taken in October 2000 and the GALEX spectrum taken in June 2009, respectively. We note that data taken with the UVW1 filter are uncertain, as they may be affected by coincidence losses. The lines show exponential fits to the IUE data. |
Only a lower limit can be computed for R in both triplets, being >3.7 and >2.0 for O VII and N VI, respectively, which indicates that they are formed in a low-density region. Upper limits to the electron density are 7 × 108 cm-3 for O VII and 8 × 109 cm-3 for N VI.
This result provides unambiguous evidence for the coexistence in RR Tel of a collisionally ionised plasma with the well-established low-density photoionised nebula (Hayes & Nussbaumer 1996; Young 2012).
5. The OM UV data
RR Tel was extensively monitored with the IUE satellite during the period 1978−1995 (see e.g. Hayes & Nussbaumer 1996; Mürset & Nussbaumer 1994). For reference, IUE fluxes in 1995 were 1.98, 1.22, and 2.16 × 10⁻¹³ erg cm-2 s-1 Å-1 at the effective wavelengths of the UVW2, UVM2, and UVW1 filters, respectively.
XMM-Newton OM exposures were performed in parallel with the X-ray observations. The filters used were U (effective wavelength 3440 Å), UVW1 (2910 Å), UVM2 (2310 Å) and UVW2 (2120 Å). Details about the start time and duration of the exposures in each filter are given in Table 3. In all cases the OM instrumental configuration was such that it allowed, apart form the imaging window, a small window in the centre of the field in fast mode, with a time resolution of 0.5 s. RR Tel was detected in all the four OM filters. Due to the brightness of the target, the coincidence loss corrections to the U and to some of the UVW1 observations are highly uncertain, and therefore these data are less reliable. Some of the exposures were lost due to instrumental problems. The fluxes obtained from the OM photometric measurements must be taken only as indicative, since the conversion from count rate to flux is made assuming a white dwarf-like spectral shape, and in the case of RR Tel the contribution of the nebular continuum and the emission lines is not negligible.
To make a more accurate comparison, we folded the IUE spectra through the OM filters response and we estimated the equivalent fluxes in the OM bands. The result is shown in Fig. 5. For the three OM UV filters, the 2009 value agrees nicely with the extrapolation of the IUE fluxes. The lines shown in the figure correspond to the fit of the IUE fluxes to an exponential function. The e-folding times are of the order of 23 years.
The high time resolution light curves obtained through all the filters show some degree of variability. There is not any evident correlation between the UV and the X-ray light curves. This is not surprising, because at the wavelengths sampled by the OM UV filters the dominant contributor to the spectrum is the Balmer recombination continuum, while in the range 0.2−2 keV, the spectrum is dominated by the emission from the hot star (see Fig. 6).
6. The spectral energy distribution of RR Tel
The spectral energy distribution of RR Tel from 5 to 3200 Å. is shown in Fig. 6. In order of increasing wavelength, the data shown are:
-
5−70 Å: XMM EPIC-pn “fluxed” spectrum (computed with the task efluxer of the XMM SAS), which is obtained from the count spectrum, taking into account the appropriate corrections for the energy redistribution and the effective area of the telescope, filter, and detector combination. This flux is model independent.
-
900−1200 Å: ORFEUS data taken in November 1996 (Krautter et al. 1998).
-
1200−3200 Å: IUE spectra taken in August 1995.
-
XMM-Newton OM fluxes at 2120 and 2310 Å.
Also shown in the figure is a sample of the NLTE stellar atmosphere models for hot stars mentioned in Sect. 3, normalised to the ORFEUS flux at 1100 Å, where the contribution of the recombination continuum is still negligible.
This figure does not show a formal fit, but it is just a qualitative representation of the spectral energy distribution of the system. Nevertheless, it provides some useful information:
-
The main contributor to the overall emission of the system in the X-ray/UV domain is the hot star, which dominates in the range ≈50−1200 Å.
-
At shorter wavelengths (shortward ≈30 Å), there is an excess flux that peaks at ≈20 Å. This emission was already detected by ROSAT (Jordan et al. 1994) and by Einstein (Kwok & Lehay 1984), though the low sensitivity of the instrument did not allow the authors to make any detailed analysis. As shown in the RGS spectrum (see Fig. 3), the peak seen in the EPIC-pn spectrum at this energy is due to the O VII He-like triplet.
-
Longward 1200 Å, the contribution of the recombination continuum of the photoionised nebula starts to be important (see e.g. Nussbaumer & Dumm 1997).
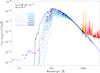
Fig. 6 Spectral energy distribution of RR Tel. The figure shows XMM-Newton EPIC, ORFEUS, and IUE data, and a set of model atmospheres normalised to the flux at 1100 Å (see the text for details). All data have been corrected for an interstellar absorption equivalent to an hydrogen column density of 2.8 × 1020 cm-2.
-
The effective temperature of the hot star is certainly between 150 and 180 kK. Assuming a radius of 0.10 R⊙, the normalisation of the models to the UV flux implies, for effective temperatures between 150 and 170 kK, distances in the range 2.7−2.8 kpc and luminosities between 4900 and 7400 L⊙. If, on the other hand, we assume a distance of 2.6 kpc, the resulting luminosities range from 4600 and 6900 L⊙ and the corresponding hot star radii between 0.09 and 0.10 R⊙. In particular for an effective temperature of 154 kK (see Sect. 3) and a distance of 2.6 kpc, the bolometric luminosity is 5000 L⊙ and the radius 0.095 R⊙.
7. Discussion
7.1. Consistency of the extinction derived from the X-ray spectrum with other determinations
Selvelli et al. (2007) obtained a quite low hydrogen column density (6.9 × 1019 cm-2) from the fitting of the profile of the damping wings of the interstellar Lyman α absorption line in a STIS high-resolution spectrum. However, an accurate re-examination of the data has revealed the presence, previously unnoticed, of a wide and shallow emission component for the Lyman α line. Therefore, the observed profile is essentially useless for comparison with the theoretical one. We note, however, that a lower limit to the column density can be derived from the comparison of the width of the saturated part of the profile with the theoretical one calculated for a fully damped profile. The width of the saturated profile is very sensitive to the column density and, alone, represents a good criterion for its estimate. The observed width of the saturated profile (3.8 Å) corresponds to a lower limit of about 2.8 × 1020 cm-2. This value agrees very well with the column density derived from the fit to the X-ray spectrum (see Sect. 3) and would correspond to E(B − V) ≈ 0.047, assuming a standard gas-to-dust ratio of 6(±2) × 1021 (e.g. Bohlin et al. 1978).
However, the observed decrement of 20 recombination lines belonging to the He II Fowler series convincingly indicates that E(B − V) ≈ 0.00, a value confirmed by the STIS continuum energy distribution in the near UV region (Selvelli et al. 2007).
This apparently contrasting evidence can be reconciled if an anomalous gas-to-dust ratio towards RR Tel is present, associated with its large distance to the galactic plane (≥1.3 kpc) and/or if there is an extra contribution to NH by a circumstellar component.
Absorption lines in the STIS spectrum of RR Tel.
7.2. The detection of wind signatures
As pointed out in Sects. 1 and 3, the hard X-ray component detected by Einstein and ROSAT was attributed by Kwok & Lehay (1984) and by Jordan et al. (1994) to bremsstrahlung emission from a high-temperature gas in the shock region, where the allegedly fast wind of the hot star and the wind of the M5 III star collide.
Hydrodynamical modelling of colliding winds in symbiotic systems predicts a warped thin shell, where the two winds collide and plasma temperatures up to 107 K are expected (Nussbaumer & Walder 1993; Mürset et al. 1997). Unfortunately, the predicted X-ray emission is only an indirect evidence for wind collision, whose positive detection requires the presence of spectral features attributable to a wind, e.g. P Cygni profiles and/or violet displaced absorptions.
As extensively described by Nussbaumer & Dumm (1997), detailed searches on IUE spectra taken from 1978 to 1992 for spectroscopic signatures of the expected fast stellar wind from the hot star gave negative results. These authors pointed out that the lack of detection was attributable to the limited dynamical range of IUE which did not allow the absorption components of very strong emission lines on top of a weak continuum to be observed. However, the same result was obtained from the examination of HST-GHRS spectra taken in 1995, whose signal in the continuum was much better. This negative result led Nussbaumer & Dumm (1997) to conclude that there was no trace of mass-loss from 1978 onwards. Clearly, the absence was difficult to reconcile with the proposed mechanism of production of hard X-rays by colliding winds.
However, careful examination of the STIS spectrum has led us to clearly detect the presence of these long-searched displaced absorption components in both the N V and the C IV resonance lines (see Table 5 and Fig. 7). The displacement at the line centre corresponds to −300 km s-1, while the terminal velocity is close to 400 km s-1, in satisfactory agreement with the 500 km s-1 estimated by Jordan et al. (1994). The lines have similar widths and similar profiles. A closer inspection of the absorption lines in the N V doublet, after a moderate filtering, actually shows the presence of two components separated by about 30 km s-1. These features are sharp and nearly symmetric. The residual flux at the line centre is low but not zero, close to 10% of the continuum level.
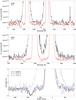 |
Fig. 7 Upper panels: comparison of the profiles of the N V and C IV resonance doublets in the GHRS and STIS spectra of RR Tel taken in 1995 and 2000, respectively. The weak emission line longward the N Vdoublet is C III 1247.3 Å. Its width is similar in both spectra: 0.06 Å in STIS and 0.07 Å in GHRS. Bottom panel: comparison of the STIS profiles of the two N V lines and the 1548 Å C IV line. The grey line shows, for reference, the N V 1238 Å line in the GHRS spectrum. The four spectra shown in this panel have been normalised to the continuum. |
We note that the outflow is not in the form of the classical P Cygni profile as observed in early-type stars and that there is no physical association between the displaced absorption components and the emission components in the resonance lines of C IV and N V, which display a nearly symmetric profile and are of nebular origin. The absence of a typical P Cygni profile positively indicates that the wind phenomenology is far from that of a continuous outflow in a spherically symmetric, extended region.
The displaced absorption lines observed in the STIS spectrum of RR Tel are evocative of the narrow, shortward displaced absorption components (DACs) observed in the resonance lines of the UV spectra of early-type stars and ascribed to a discontinuous, inhomogeneous loss of matter, which results in “puffs” of material ejected at irregular intervals (e.g. Lamers et al. 1978; Kaper & Henrichs 1994).
In most cases the two phenomena of P Cygni and DACs co-exist, but there are cases in which only the sharp displaced components are observed. In a study of the symbiotic star AG Dra, Mikolajewska et al. (1995) reported that the N V 1240 Å line often displayed weak blue-shifted absorption components, suggesting a low velocity wind from the hot component at velocities of a few hundred km s-1. Sekeráš & Skopal (2012) reported the presence of a sharp absorption component in the 1032 Å line in a FUSE spectrum of V1016 Cyg during a quiescent phase. This feature corresponds to an outflow with velocity of about −250 km s-1.
The presence of DACs in the UV resonance lines and of structured absorption troughs that come and go on short, aperiodic time scales has also been observed in the winds emanating from the accretion disk of cataclysmic variables in high state (e.g. Mauche 1991; Selvelli & Friedjung 2003). Also, Orio (2012) reported that X-ray observations of novae and recurrent novae have shown that mass seems to be lost in “parcels” or discrete shells. In the case of RR Tel, the paucity of the data (one GHRS observation showing no wind, one STIS observation showing displaced absorption components) prevents any definite statement about the origin and phenomenology of the observed DACs.
An estimate for the plasma temperature in the shock can be derived from the terminal
velocity of the hot wind vinf. Since the thermal energy per
particle can not exceed the kinetic energy per particle in the wind (Mürset et al. 1997), the simple relation
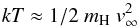 (1)gives
T ≤ 2.9 × 10⁶ K (for
v∞ = 380 km s-1).
(1)gives
T ≤ 2.9 × 10⁶ K (for
v∞ = 380 km s-1).
A crude estimate of the ionic column density in the wind can be obtained from the
equivalent width of the displaced absorptions and the relation
 (2)valid in the assumption of optically thin
lines, which gives lower limits of about 1.4 × 1014 cm-2 and
0.8 × 1013 cm-2 for the column density of the N+4
and C+3 ions in the wind.
(2)valid in the assumption of optically thin
lines, which gives lower limits of about 1.4 × 1014 cm-2 and
0.8 × 1013 cm-2 for the column density of the N+4
and C+3 ions in the wind.
7.3. RR Tel still burning
Symbiotic novae like RR Tel represent a small subclass of the symbiotic stars (Mürset & Nussbaumer 1994). The outburst mechanism in symbiotic novae is generally assumed to be similar to that of classical novae, i.e. a thermonuclear runaway (TNR) on the surface of a white dwarf, although it differs mainly for the slower outburst speed (Nussbaumer 1998).
In this context, RR Tel represents an extreme case of slow spectral evolution after outburst, with a timescale much longer than that commonly observed in classical novae. Our XMM-Newton observations have clearly demonstrated that the supersoft component still dominates the spectral energy distribution, about 65 years after the outburst of 1944. The presence of mass-loss signatures in the N V and C IV resonance lines is an independent confirmation that outflow from the white dwarf, a direct consequence of the outburst, was still going on at the time of the STIS observations. This behaviour is in contrast with that of classical novae, where the post-outburst supersoft X-ray emission, indicative of remaining H-nuclear burning, lasts a few years at maximum (see Hernanz 2012).
Mürset & Nussbaumer (1994) attributed the difference in the outburst behaviour to differences in mass accretion rates between classical and symbiotic novae: the higher accretion rate in symbiotic novae from the wind of the giant increases compressional heating and inhibits degeneracy in the accreted shell, and this eventually would lead to a slower outburst. We point out, however, that theoretical models of nova outburst (e.g. Yaron et al. 2005) predict that the white dwarf mass is the main parameter that rules the turn-off time. In classical novae, a slow spectral evolution is generally attributed to the presence of a low-mass white dwarf in the system and/or to inefficient mass-loss mechanism after outburst.
Based on the TNR models of Yaron et al. (2005), we guess that the extreme slowness of the outburst of RR Tel should be primarily ascribed to the presence of an undermassive white dwarf (≤0.65 M⊙) in the system and not to higher accretion from the wind of the giant, as proposed by Mürset & Nussbaumer (1994). Two well known recurrent novae, T CrB and RS Oph, have an M giant companion but are characterised by a very short duration of the outburst. These two objects are known to have a massive white dwarf that clearly determines the principal outburst characteristics.
If a low-mass white dwarf is indeed present in RR Tel, TNR models require the accumulation of a massive hydrogen envelope to trigger ignition, and, in the observational side, the presence of a moderate expansion velocity in the ejecta. As a matter of fact, Thackeray (1977) reported that the observed displacements in the absorption components were less than those for an “average” slow nova and considerably less than those of faster novae.
A rough calculation of the ejected mass can be obtained from the estimated radius of the nebula, 1015 cm (Hayes & Nussbaumer 1996). This radius, together with the assumption of a homogeneous shell with electron density Ne = 3 × 106 cm-3 in the emission-line region (Hayes & Nussbaumer 1996), provides a lower limit of ~10-5 M⊙ for the total mass of the ejecta.
A more accurate determination of the mass of ionised hydrogen in the nebula can be obtained from the Hβ luminosity, Lβ = 1.42 × 1034 erg s-1, which is obtained from the Hβ flux measured in STIS (1.62 × 10⁻¹¹ erg cm-2 s-1), assuming a distance of 2.6 kpc.
By combining the two common relations
 (3)and
 (4)(where μ = 1.4 is the mean
atomic weight and ϵ is the filling factor), one finds that the hydrogen
mass of the nebula (independent of ϵ and
Rneb) is
(4)(where μ = 1.4 is the mean
atomic weight and ϵ is the filling factor), one finds that the hydrogen
mass of the nebula (independent of ϵ and
Rneb) is
 (5)If
Ne ~ 3 × 106 cm-3 (Hayes & Nussbaumer 1996), one finally obtains that
Mneb ~ 4.4 × 10⁻⁵ M⊙.
(5)If
Ne ~ 3 × 106 cm-3 (Hayes & Nussbaumer 1996), one finally obtains that
Mneb ~ 4.4 × 10⁻⁵ M⊙.
Using the observed intensities of the λ 1640 and λ 4686 recombination lines, similar calculations for the mass of fully ionised helium give MHe + + ~ 3.5 × 10⁻⁶ M⊙.
We note that a correction for reddening would have increased the line luminosities, and then these values should be considered as lower limits. A total envelope mass of about 10-4 M⊙ is therefore indicated by the considerations of above.
8. Conclusions
We have analysed the observations of RR Tel taken with XMM-Newton in April 2009, which comprise high- and low-resolution X-ray spectroscopy and UV photometry.
In the UV, the comparison of the OM photometry with IUE spectra shows a gradual fading of the near UV flux, which is dominated by the recombination continuum of the nebula.
The emission in the X-ray spectral range is due to a main component arising from the hot white dwarf, and a second component due to the shocked gas within the system. While the first one had already been detected by ROSAT in 1992 and confirmed by a Swift observation in 2007, this is the first time that the shocked-induced gas emission has been studied in detail, as it was only barely detected with ROSAT.
We compared the supersoft emission with NLTE model atmospheres and we found that it is compatible with a hot star with solar abundances, a surface gravity of log g = 6, and a temperature of 154 kK. Assuming a distance of 2.6 kpc, the luminosity would be 5000 L⊙. Following a different approach, that normalises the model atmospheres to the ORFEUS flux at 1100 Å, we arrive at a similar luminosity: 4600 L⊙ for a temperature of 150 kK.
Two plasma components are needed to explain the observed X-ray spectrum: one with kT = 0.04 keV, an emission measure of E.M. = 1059 cm3, which is absorbed by a hydrogen column density of NH = 2.2 × 1021 cm-2, and a second one with kT = 0.11 keV, E.M. = 7 × 1056 cm3, and NH = 4.2 × 1021 cm-2.
Further information on the physical properties of the gas are provided by the high-resolution RGS spectra. Only a few emission lines are detected, but the He-like triplets of O VII and N VI clearly show that the X-ray emitting gas is collisionally ionised. The temperatures determined from the relative intensities of the lines in these triplets fully agree with those derived from the EPIC low-resolution spectra: 0.05 keV from N VI and 0.15 keV from O VII. The intercombination line is extremely weak in both triplets, thus allowing us to give only an upper limit to the electron density: 7 × 10⁸ and 2 × 109 cm-3 from O VII and N VI, respectively.
Previous studies had failed to find spectroscopic signatures of the wind of the hot star. We have re-examined the existing STIS spectrum and found weak blueshifted absorptions in the N V and C IV UV doublets. The upper limit to the temperature of the gas in the shock, which was derived from the terminal velocity of the absorption lines (2.9 × 10⁶ K, 0.25 keV), is fully compatible with the values obtained from the X-ray data.
The absence of typical P Cygni profiles indicates that the wind geometry is far from being spherically symmetric. The wind is not in the form of a continuous outflow of gas but likely in the form of a discontinuous, inhomogeneous ejection.
XMM-Newton observations have confirmed the presence and persistence of burning activity on the surface of the hot component for more than 65 years after outburst, as evidenced by the supersoft and hard components. To explain this long duration, TNR models for the outburst necessarily require the presence of a low-mass white dwarf, which they associate with the presence a rather massive envelope and with outflow at moderate velocities. Direct and circumstantial evidences, based on STIS observations and historical data (e.g. Thackeray 1977), seem to confirm this picture.
Acknowledgments
This work is based on observations obtained with XMM-Newton, an ESA science mission with instruments and contributions directly funded by ESA Member States and NASA, and on INES data from the IUE satellite. Some of the data presented in this paper were obtained from the Mikulski Archive for Space Telescopes (MAST). STScI is operated by the Association of Universities for Research in Astronomy, Inc., under NASA contract NAS5-26555. Support for MAST for non-HST data is provided by the NASA Office of Space Science via grant NNX09AF08G and by other grants and contracts. We acknowledge with thanks the variable star observations from the AAVSO International Database contributed by observers worldwide and used in this research. We are grateful to the referee, Dr. P. Young, for his interesting remarks, which have stimulated a more detailed discussion of some of the points reported in the paper.
References
- Bohlin, R., Savage, B. D., & Drake, J. 1978, ApJ, 224, 132 [NASA ADS] [CrossRef] [Google Scholar]
- González-Riestra, R., Cassatella, A., & Selvelli, P. 2012, Mem. Soc. Astron. It., 83, 806 [NASA ADS] [Google Scholar]
- Harper, G. M., Jordan, C., Judge, P. G., Robinson, R. D., et al. 1999, MNRAS, 303, L41 [NASA ADS] [CrossRef] [Google Scholar]
- Hayes, M. A., & Nussbaumer, H. 1996, A&A, 161, 287 [Google Scholar]
- Hernanz, M. 2012, Mem. Soc. Astron. It., 83, 787 [NASA ADS] [Google Scholar]
- Jordan, S., Mürset, U., & Werner, K. 1994, A&A, 283, 475 [NASA ADS] [Google Scholar]
- Kaper, L., & Henrichs, H. F. 1994, Ap&SS, 221, 115 [NASA ADS] [CrossRef] [Google Scholar]
- Krautter, J., Appenzeller, I., Mandel, H., et al. 1998, in UV Astronomy Beyond the IUE Final Archive, ESA SP, 413, 347 [Google Scholar]
- Kwok, S., & Lehay, D. A. 1984, ApJ, 283, 675 [NASA ADS] [CrossRef] [Google Scholar]
- Lamers, H. J. G. L. M., Stalio, R., & Kondo, Y. 1978, ApJ, 223, 207 [NASA ADS] [CrossRef] [Google Scholar]
- Landi, E., Del Zanna, G., Young, P., Dere, K., & Mason, H. 2012, ApJ, 744, 99 [NASA ADS] [CrossRef] [Google Scholar]
- Mauche, C. W. 1991, ApJ, 373, 624 [NASA ADS] [CrossRef] [Google Scholar]
- Mikolajewska, J., Kenyon, S. J., Mikolajewski, M., Garcia, M. R., & Polidan, R. S. 1995, AJ, 109, 1289 [NASA ADS] [CrossRef] [Google Scholar]
- Mürset, U., & Nussbaumer, H. 1994, A&A, 282, 586 [NASA ADS] [Google Scholar]
- Mürset, U., Nussbaumer, H., Schmid, H. M., & Vogel, M. 1991 A&A, 248, 458 [NASA ADS] [Google Scholar]
- Múrset, U., Wolff, B., & Jordan, S. 1997, A&A, 319, 201 [NASA ADS] [Google Scholar]
- Ness, J. U., Starrfield, S., Osborne, J. P., Page, K., & Schwarz, G. 2007, CBET, 1134 [Google Scholar]
- Nussbaumer, H. 1998, in Ultraviolet Astrophysics Beyond the IUE Final Archive, ESA SP, 413, 333 [Google Scholar]
- Nussbaumer, H., & Dumm, T. 1997, A&A, 323, 387 [NASA ADS] [Google Scholar]
- Nussbaumer, H., & Walder, R. 1993, A&A, 278, 209 [NASA ADS] [Google Scholar]
- Orio, M. 2012, Bull. Astron. Soc. Ind., 40, 333 [Google Scholar]
- Penston, M. V., Benvenuti, P., Cassatella, A., et al. 1983, MNRAS, 202, 833 [NASA ADS] [CrossRef] [Google Scholar]
- Porquet, D., & Dubau, J. 2000, A&AS, 143, 495 [NASA ADS] [CrossRef] [EDP Sciences] [Google Scholar]
- Porquet, D., Mewe, R., Dubau, J., Raasen, A. J. J., & Kaastra, J. S. 2001, A&A, 376, 1113 [NASA ADS] [CrossRef] [EDP Sciences] [Google Scholar]
- Porquet, D., Dubau, J., & Grosso, N. 2010, Space Sci. Rev., 157, 103 [NASA ADS] [CrossRef] [Google Scholar]
- Rauch, T. 2003, A&A, 403, 709 [NASA ADS] [CrossRef] [EDP Sciences] [Google Scholar]
- Sekeráš, M., & Skopal, A. 2012, MNRAS, 427, 979 [NASA ADS] [CrossRef] [Google Scholar]
- Selvelli, P., & Bonifacio, P. 2000, A&A, 364, L1 [NASA ADS] [Google Scholar]
- Selvelli, P., & Friedjung, M. 2003, A&A, 401, 297 [NASA ADS] [CrossRef] [EDP Sciences] [Google Scholar]
- Selvelli, P., Beeckmans, F., Macchetto, F., et al. 1979, Mem. Soc. Astron. It., 50, 215 [NASA ADS] [Google Scholar]
- Selvelli, P., Danziger, J., & Bonifacio, P. 2007, A&A, 464, 71 [Google Scholar]
- Thackeray, A. D. 1977, MmRAS, 83, 1 [Google Scholar]
- Whitelock, P. 1988, in The Symbiotic Phenomenon, ASSL, 145, 47 [Google Scholar]
- Yaron, O., Prialnik, D., Shara, M., & Kovetz, M. 2005, ApJ, 623, 398 [NASA ADS] [CrossRef] [Google Scholar]
- Young, P. R. 2012, ApJ, 749, 1 [Google Scholar]
- Young, P. R., Feldman, U., & Lobel, A. 2011, ApJS, 196, 23 [NASA ADS] [CrossRef] [Google Scholar]
All Tables
All Figures
|
Fig. 1 XMM-Newton EPIC spectra of RR Tel. For clarity, the spectra shown here have been rebinned in order to oversample the full width half maximum of the energy resolution by a factor 3 and to have a minimum of ten counts per bin. |
| In the text | |
|
Fig. 2 Detail of XMM-Newton EPIC-pn spectrum of RR Tel showing the fit to the atmosphere model and the two MEKAL plasmas. Though the fit has been performed using the data from the three EPIC cameras, only EPIC-pn is shown for clarity. |
| In the text | |
|
Fig. 3 RGS fluxed spectrum of RR Tel. This spectrum is a combination of RGS1 and RGS2 data. The labels mark the strongest lines. |
| In the text | |
|
Fig. 4 O VII (RGS1) and N VI (RGS2) He-like multiplets in RR Tel. The spectra have been binned to a minimum of three counts per bin. The red line shows the best-fit model for the resonance and forbidden lines. The intercombination line is shown with its intensity set to the upper obtained from the fit. Dips due to bad columns are clearly seen near 21.6 and 21.8 Å. The blue line in the top panel shows the analytical representation of the three Gaussians, broadened with the instrumental width (≈0.07 Å FWHM) and having the intensities derived in the fit. |
| In the text | |
|
Fig. 5 Evolution of the UV flux of RR Tel. Triangles are fluxes in the XMM-Newton OM bands computed from IUE spectra. Filled circles are fluxes measured by the XMM-Newton OM. Squares and diamonds are points derived from the STIS spectrum taken in October 2000 and the GALEX spectrum taken in June 2009, respectively. We note that data taken with the UVW1 filter are uncertain, as they may be affected by coincidence losses. The lines show exponential fits to the IUE data. |
| In the text | |
|
Fig. 6 Spectral energy distribution of RR Tel. The figure shows XMM-Newton EPIC, ORFEUS, and IUE data, and a set of model atmospheres normalised to the flux at 1100 Å (see the text for details). All data have been corrected for an interstellar absorption equivalent to an hydrogen column density of 2.8 × 1020 cm-2. |
| In the text | |
|
Fig. 7 Upper panels: comparison of the profiles of the N V and C IV resonance doublets in the GHRS and STIS spectra of RR Tel taken in 1995 and 2000, respectively. The weak emission line longward the N Vdoublet is C III 1247.3 Å. Its width is similar in both spectra: 0.06 Å in STIS and 0.07 Å in GHRS. Bottom panel: comparison of the STIS profiles of the two N V lines and the 1548 Å C IV line. The grey line shows, for reference, the N V 1238 Å line in the GHRS spectrum. The four spectra shown in this panel have been normalised to the continuum. |
| In the text | |
Current usage metrics show cumulative count of Article Views (full-text article views including HTML views, PDF and ePub downloads, according to the available data) and Abstracts Views on Vision4Press platform.
Data correspond to usage on the plateform after 2015. The current usage metrics is available 48-96 hours after online publication and is updated daily on week days.
Initial download of the metrics may take a while.