Fig. 5
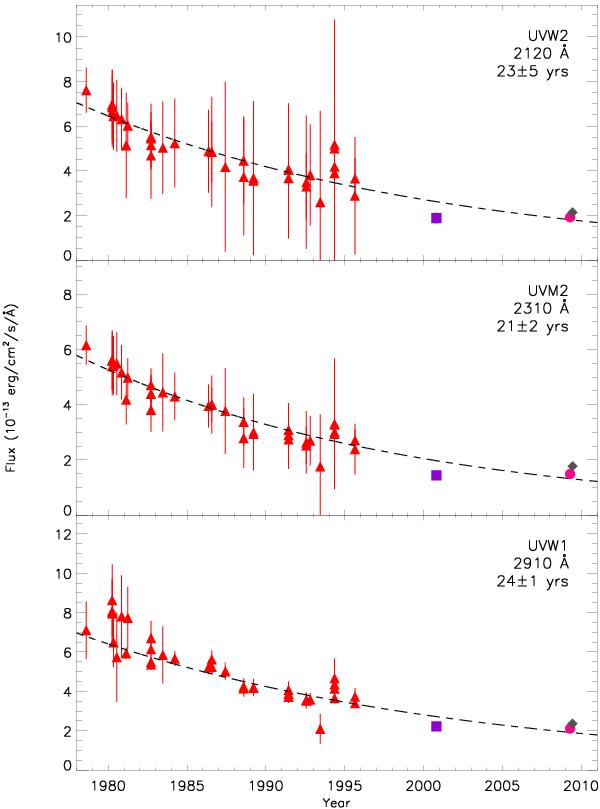
Evolution of the UV flux of RR Tel. Triangles are fluxes in the XMM-Newton OM bands computed from IUE spectra. Filled circles are fluxes measured by the XMM-Newton OM. Squares and diamonds are points derived from the STIS spectrum taken in October 2000 and the GALEX spectrum taken in June 2009, respectively. We note that data taken with the UVW1 filter are uncertain, as they may be affected by coincidence losses. The lines show exponential fits to the IUE data.
Current usage metrics show cumulative count of Article Views (full-text article views including HTML views, PDF and ePub downloads, according to the available data) and Abstracts Views on Vision4Press platform.
Data correspond to usage on the plateform after 2015. The current usage metrics is available 48-96 hours after online publication and is updated daily on week days.
Initial download of the metrics may take a while.