Fig. 4
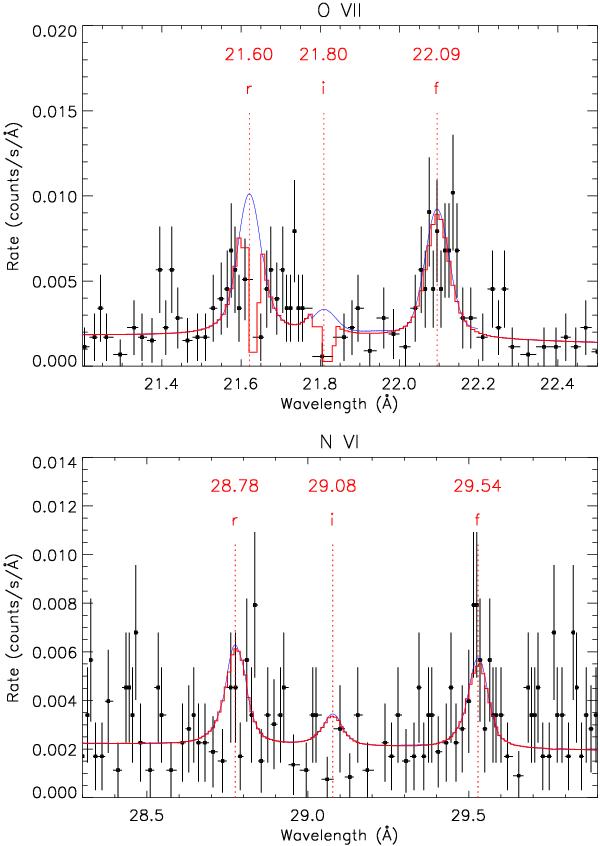
O VII (RGS1) and N VI (RGS2) He-like multiplets in RR Tel. The spectra have been binned to a minimum of three counts per bin. The red line shows the best-fit model for the resonance and forbidden lines. The intercombination line is shown with its intensity set to the upper obtained from the fit. Dips due to bad columns are clearly seen near 21.6 and 21.8 Å. The blue line in the top panel shows the analytical representation of the three Gaussians, broadened with the instrumental width (≈0.07 Å FWHM) and having the intensities derived in the fit.
Current usage metrics show cumulative count of Article Views (full-text article views including HTML views, PDF and ePub downloads, according to the available data) and Abstracts Views on Vision4Press platform.
Data correspond to usage on the plateform after 2015. The current usage metrics is available 48-96 hours after online publication and is updated daily on week days.
Initial download of the metrics may take a while.