Fig. 1
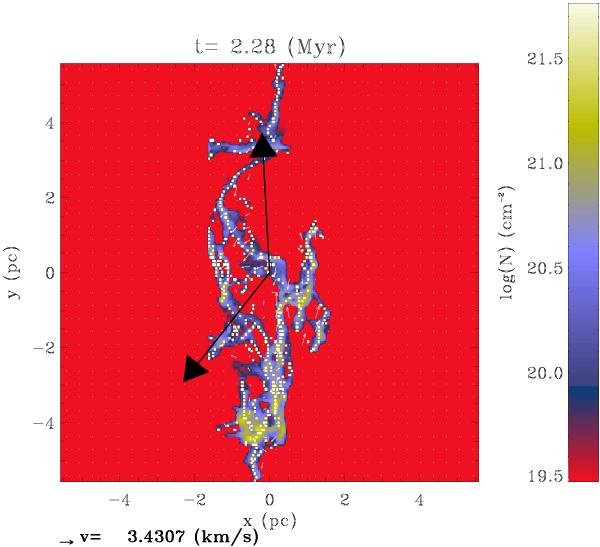
Column density and velocity field for one of the clumps formed in the MHD simulations. The white points represent the local mass center Gij and constitute the skeleton of the clump. The upward pointing arrow represents the filament main axis as computed with the inertia matrix. The downward pointing arrow represents the main direction of the strain as computed with the strain tensor.
Current usage metrics show cumulative count of Article Views (full-text article views including HTML views, PDF and ePub downloads, according to the available data) and Abstracts Views on Vision4Press platform.
Data correspond to usage on the plateform after 2015. The current usage metrics is available 48-96 hours after online publication and is updated daily on week days.
Initial download of the metrics may take a while.