Fig. 6
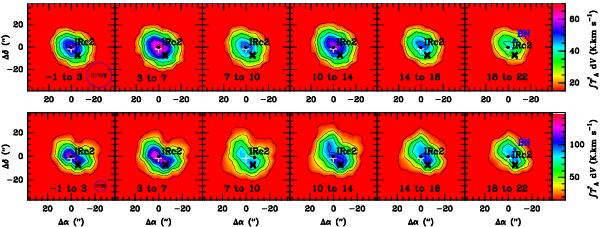
SO-integrated intensity maps over different velocity ranges (indicated at the bottom of each panel in km s-1). Row 1 shows the transition 32−21 (Eup = 21.1 K, Aul = 1.1 × 10⁻⁵ s-1, S = 1.5). The interval between contours is 8 K km s-1 and the minimum contour is 15 K km s-1. Row 2 shows the transition 66−55 (Eup = 56.5 K, Aul = 2.2 × 10⁻⁴ s-1, S = 5.8). The interval between contours is 20 K km s-1 and the minimum contour is 15 K km s-1. The white cross indicates the position of the hot core and the black cross the position of the compact ridge.
Current usage metrics show cumulative count of Article Views (full-text article views including HTML views, PDF and ePub downloads, according to the available data) and Abstracts Views on Vision4Press platform.
Data correspond to usage on the plateform after 2015. The current usage metrics is available 48-96 hours after online publication and is updated daily on week days.
Initial download of the metrics may take a while.