Free Access
Fig. 13
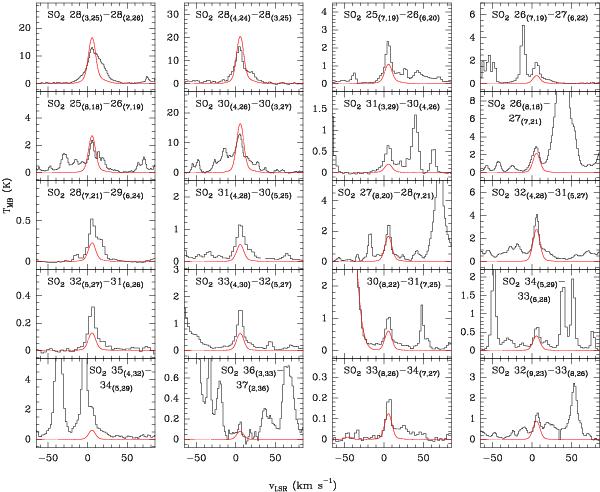
Observed lines of SO2 (black histogram) with upper state energies between 400 K and 700 K, ordered by increasing energy from top left to bottom right. Best fit LTE model results are overlaid in red.
Current usage metrics show cumulative count of Article Views (full-text article views including HTML views, PDF and ePub downloads, according to the available data) and Abstracts Views on Vision4Press platform.
Data correspond to usage on the plateform after 2015. The current usage metrics is available 48-96 hours after online publication and is updated daily on week days.
Initial download of the metrics may take a while.