Free Access
Fig. 1
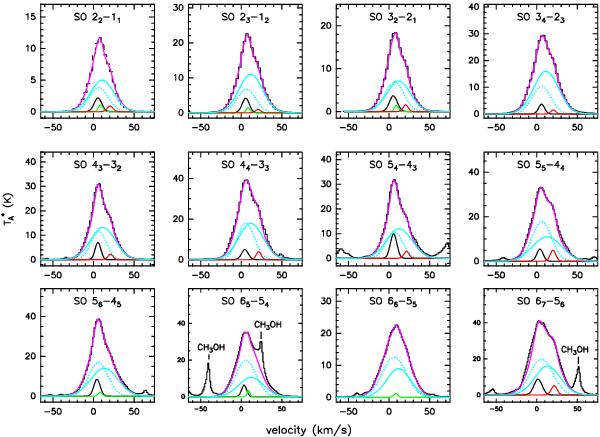
Gaussian fits to the observed SO lines. Dashed line for the plateau, cyan (solid line) for the high-velocity plateau, black for hot core, green for extended ridge, and red for the contribution of the component at 20.5 km s-1. The total fit is shown in magenta. The data are the black histogram spectra.
Current usage metrics show cumulative count of Article Views (full-text article views including HTML views, PDF and ePub downloads, according to the available data) and Abstracts Views on Vision4Press platform.
Data correspond to usage on the plateform after 2015. The current usage metrics is available 48-96 hours after online publication and is updated daily on week days.
Initial download of the metrics may take a while.