| Issue |
A&A
Volume 556, August 2013
|
|
|---|---|---|
| Article Number | A6 | |
| Number of page(s) | 11 | |
| Section | Astrophysical processes | |
| DOI | https://doi.org/10.1051/0004-6361/201321054 | |
| Published online | 17 July 2013 | |
Dust heating
Photon absorption versus electron collisions
1 Institut d’Astrophysique Spatiale (IAS), UMR 8617, CNRS/Université Paris-Sud, 91405 Orsay, France
e-mail: This email address is being protected from spambots. You need JavaScript enabled to view it.
2 Institute for Astronomy, Astrophysics, Space Applications & Remote Sensing, National Observatory of Athens, P. Penteli, 15236 Athens, Greece
3 Department of Physics and Astronomy, University of Western Ontario, London, Ontario N6A 3K7, Canada
4 INAF – Osservatorio Astrofisico di Arcetri, Largo E. Fermi 5, 50125 Florence, Italy
Received: 7 January 2013
Accepted: 18 June 2013
Abstract
Aims. We investigate and quantify the effects of the electron collisional heating of dust in a hot gas and compare this with photon heating by the interstellar radiation field.
Methods. We compare the rate of energy absorption by dust due to electron collisional and photon heating as a function of the physical conditions of the gas and the ambient radiation field. We calculate the resulting dust spectral energy distributions (SEDs) for different environments.
Results. We find that electron collisions and grain charging effects in a hot gas (106 − 107 K) rapidly destroy small carbonaceous particles and result in a minimum particle size of the order of a few nm. The charging due to the emission of secondary electrons is important and leads to high electric potentials, which quickly destroy the small grains by field ion emission. In the case of weak interstellar radiation fields (G0 ~ 0.1), electron collisional heating can be the dominant heating process and therefore makes an important contribution to the dust thermal emission.
Conclusions. Collisions of electrons with dust grains, in a hot gas, lead to important changes in the dust SED, as a result of their high energy input. We find that grain charge effects and accompanying erosion need to be taken into account in the calculation of the dust SED. The power absorbed by the dust as a result of electron collisions in a hot tenuous gas can be larger than that due to photon absorption in the intergalactic medium close to a galaxy where the radiation field is weak (G0 ≲ 0.1).
Key words: dust, extinction / radiation mechanisms: thermal / galaxies: clusters: intracluster medium / radiative transfer / galaxies: individual: NGC 891
© ESO, 2013
1. Introduction
Observations of ram-pressure stripped galaxies in the Virgo Cluster have shown a correlation and an asymmetry of dust and gas profiles with respect to the galactic plane (e.g. Cortese et al. 2010). Dust and gas pushed outside the boundaries of a galaxy will encounter a different, more tenuous and much warmer environment than the interstellar medium (ISM): the intergalactic medium (IGM). Since the IGM is a very hot and tenuous medium (T ≈ 105−108 K, nH ≈ 10-3−10-4 cm-3), dust will not only be heated by the photon absorption but also by electron collisions, which could play an important role. Furthermore, there are other environments where electron collisional heating may be important i.e. high- and intermediate-velocity clouds (HVCs and IVCs), galactic fountains and in the hot ionised medium (HIM) or coronal gas in the Milky Way or elliptical galaxies.
However, both of these grain heating processes, i.e. photon absorption and electron collisions, will contribute not only to dust heating but also to its destruction (see Micelotta et al. 2010; Bocchio et al. 2012, for particle erosion in a hot gas). In particular, this would mostly affect the smallest grains in the size distribution.
In this paper, we introduce electron collisional heating into the DustEM code1 and compare its effect with that due to photon absorption in the IGM in order to investigate if dust would be able to emit enough energy to be detected by modern infrared/far-infrared (FIR) telescopes.
2. The dust model
In this work we use the Compiègne et al. (2011) dust model. This dust model consists of four types of grains: polycyclic aromatic hydrocarbons (PAHs), small and large hydrogenated amorphous carbon (SamC and LamC) grains and silicate grains (aSil). The PAHs and SamC grains follow a log normal (dn/d![Mathematical equation: \hbox{$\log\,a \propto \exp[-\frac{\log(a/a_0)^2}{2\sigma^2}]$}](/articles/aa/full_html/2013/08/aa21054-13/aa21054-13-eq8.png) ) size distribution while the LamC grains and silicate grains follow a power law (dn/da ∝ aα) starting at amin and with an exponential cut-off of the form e−[(a−at)/ac]γ for a ≥ at (1 otherwise). The parameters that characterize the size distributions are summarized in Table 1 and the corresponding mass distribution is plotted in Fig. 1.
) size distribution while the LamC grains and silicate grains follow a power law (dn/da ∝ aα) starting at amin and with an exponential cut-off of the form e−[(a−at)/ac]γ for a ≥ at (1 otherwise). The parameters that characterize the size distributions are summarized in Table 1 and the corresponding mass distribution is plotted in Fig. 1.
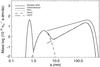 |
Fig. 1 Mass distributions for the four dust types of the Compiègne et al. (2011) model as a function of the grain radius. |
Size distribution parameters for the Compiègne et al. (2011) dust model (see text for details).
It is clear from Bocchio et al. (2012) that, for small carbonaceous particles ( nm), the 2D and 3D effective cross sections are equivalent. This allows us to use a 3D approach to describe PAH destruction.
3. Electron collisional heating
In a fully ionised hot coronal-type gas, be it galactic HIM or nearby IGM, dust is heated by inelastic collisions with the ambient ions and electrons. At a given gas temperature, ions and electrons will have the same energy but, because electrons have a much smaller mass, they will reach higher velocities with respect to the ions. This implies that the electron flux is larger than that of the ions and therefore the major contribution to the collisional heating is given by electrons. The effect of electron collisional heating has already been studied in the case of dust in a low density, X-ray emitting plasma by Dwek (1986, 1987) who calculated the equilibrium temperature of very small grains heated only by collisions with the ambient electrons of a hot gas (T ≈ 107 K). He also calculated the dust-temperature distribution which is a key factor in determining the dust spectral energy distribution (SED).
Following Dwek (1986), the power absorbed per grain (be it a carbon or a silicate grain) due to electron collisions is given by: 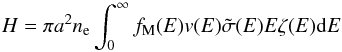 (1)where a is the grain radius, ne is the electron density (which equals the proton density, nH, since the gas is fully ionised), fM(E) is the Maxwell-Boltzmann energy distribution, v(E) the velocity of the impinging electron, E its energy,
  represents the Coulomb focusing and ζ(E) the fraction of energy transferred to the target grain. As discussed in Sect. 6, Coulomb focusing has little effect on the grain charge under these conditions and is ignored here.
Dwek (1986) gives an estimate of the transferred energy, Eζ(E), as a function of the energy of the impinging electron: ![Mathematical equation: \begin{equation} \zeta(E) = \begin{cases} 1 & \mbox{for } E<E_{\rm{th}} \\ 1 - \left[1-(E_{\rm{th}}/E)^{3/2} \right]^{2/3} & \mbox{for } E > E_{\rm{th}} \end{cases} \end{equation}](/articles/aa/full_html/2013/08/aa21054-13/aa21054-13-eq41.png) (2)with the threshold energy Eth(erg) = 3.7 × 10⁻⁸ a(μm)2/3.
(2)with the threshold energy Eth(erg) = 3.7 × 10⁻⁸ a(μm)2/3.
Dwek (1987) updates his previous estimate of the transferred energy function in electron collisions. His study is based on the experimental ranges of electrons in all media within the energy range of 20 eV to 1 MeV (Iskef et al. 1983; Berger & Seltzer 1964). This new estimate of the energy transferred is functionally very similar to the previous estimate but it has a lower threshold. Dwek (1987) does not give a simple expression for the threshold energy. For a 0.1 μm carbonaceous grain of density ρ = 1.8 g cm-3, following his method, as we can deduce from Fig. 1 by Dwek (1987), the threshold energy equals Eth ~ 1.4 keV (see Fig. 2).
 |
Fig. 2 Transferred energy as a function of the kinetic energy of the impinging electrons for carbonaceous and silicate grains with a radius of 0.1 μm. Carbonaceous grain (black lines): solid line (Micelotta et al. 2010), dotted line (Dwek 1986), dashed line (Dwek 1987). Silicate grain, grey solid line (Dwek 1987). |
Analytical fit (to within few %) to the electron stopping power in solid carbon (Micelotta et al. 2010).
A more recent approach is given by Micelotta et al. (2010). They derive the electron energy loss (for E = 10 eV − 2 keV) in carbon from measurements of dE/dx for solid carbon (Joy 1995). The data points are well fit by the following function:  (3)where S(E) is the stopping power and E the energy of the impinging electron. The fit parameters are listed in Table 2. In order to find the transferred energy to a spherical grain due to electron collisions Micelotta et al. (2010) used the following procedure. Since S(E) = − dE/dx, integrating over the electron path through the grain we find:
 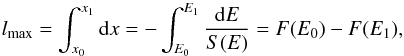 (4)where F(E) is the path length travelled by an electron with an energy E, E0 the energy of the impinging electron, E1 the energy of the electron after having travelled through the grain and lmax is the maximum path length through the grain. The value of lmax is of course limited to the maximum path length through the grain if the electrons are not stopped within the grain. In that case, the average path length traversed through a spherical grain is 4a/3. Therefore, for a given E0 we can derive E1 and we define the transferred energy as:
 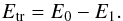 (5)In Fig. 2 we show the transferred energy as a function of the energy of the impinging electron. Black lines refer to the transferred energy into carbonaceous grains whilst the grey line refers to silicate grains. For these calculations we assume a carbon grain of density 1.8 g cm-3 and a radius of 0.1 μm and a silicate grain of density 3 g cm-3 and the same radius. We compare the three approaches described for the transferred energy into carbonaceous grains. The dotted line shows the approach of Dwek (1986), the dashed line the approach of Dwek (1987) and the black solid line the approach of Micelotta et al. (2010). We notice that, even if the methods used to calculate the transferred energy are quite different from one another, the functional behavior is very similar. The difference between the transferred energy function for carbonaceous and silicate grains adopted by Dwek (1987) is simply due to the different grain densities used there. In our model we use the transferred energy function obtained by Micelotta et al. (2010) for carbonaceous grains (black solid line) and, since there are no more recent estimates, we use that obtained by Dwek (1987) for silicate grains (grey solid line).
4. Photon heating
In regions where a radiation field is present, grains can be heated by photon absorption. In this case the power absorbed per grain (Hγ) is given by: 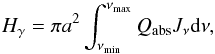 (6)where νmin and νmax are the minimum and maximum frequencies of the radiation field, πa2Qabs is the absorption cross section and Jν the intensity of the radiation field at the given frequency ν. To quantify the power absorbed in this way we need to estimate the radiation field in the region we want to consider, in this case in the IGM, a few kpc away from the galactic plane.
We focus here on the study of the radiation field in the proximity of spiral galaxies. Edge-on galaxies play an important role in this study since we have experimental data on the radiation field in the optical/near-infrared (NIR) bands around the galactic plane. A good example of an edge-on galaxy is NGC 891 and its radiation field has been widely studied in the literature (e.g. Xilouris et al. 1999; Popescu et al. 2000). We use this galaxy only as an example to have an estimate of the radiation field around a typical spiral galaxy. Xilouris et al. (1999) modeled the distribution of stars and dust in the optical and NIR bands. The stellar distribution that they use is composed of an exponential (both in the radial, R, and vertical, z, directions) disk and a bulge (which in projection is given by the well-known R1/4 law, Christensen 1990) described by: 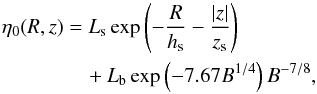 (7)where η0 is the total stellar emissivity (in erg s-1 pc-3 sr-1 nm-1) at (R,z), Ls and Lb are the normalization constants for the stellar emissivity of the disk and the bulge, hs and zs are the stellar scalelength and scaleheight and
  (8)with Re the effective radius of the bulge and a and b the semi-major and semi-minor axes respectively. To model the presence of a dust disk in the galaxy they used an exponential law for the extinction coefficient:
  (9)where κλ(R,z) is the extinction coefficient (in kpc-1) at wavelength λ at (R,z), hd and zd are the dust scalelength and scaleheight respectively. κλ(0,0), the extinction coefficient at the centre of the disk, is related to the optical depth of the galaxy as seen face-on,
  and the scaleheight:
  (10)In this work we use the parameters listed in Table 3 (Xilouris et al. 1999).
Parameters for NGC 891 derived by Xilouris et al. (1999).
The same model has been used by Popescu et al. (2000). Starting from the optical-NIR SED, they calculated the FIR SED emitted by the dust distribution and compared this with the observational data from Alton et al. (1998). The observed differences between the results of the model and the data were assumed to be due to the absence of the UV radiation field. They assumed a distribution of young stars with a scaleheight smaller than the dust scaleheight. In fact, in edge-on galaxies, it is very difficult to observe any radiation in the UV because it is absorbed by the dust lane.
To compute the radiation in the UV it is possible to use the relation between SFR and the luminosity at different UV wavelengths, based on population synthesis models (e.g. Fioc & Rocca-Volmerange 1997). Misiriotis et al. (2004) calculated this relation with the PEGASE population synthesis model of Fioc & Rocca-Volmerange (1997) and obtained: ![Mathematical equation: \begin{eqnarray*} {\it SFR} = 8.12 \times 10^{-28} L_{\lambda}\,[{\rm erg\,s}^{-1}{\rm Hz}^{-1}]\,{\rm at\,}\lambda=91.2\,{\rm nm} \\ \end{eqnarray*}](/articles/aa/full_html/2013/08/aa21054-13/aa21054-13-eq107.png) and
and ![Mathematical equation: \begin{eqnarray*} {\it SFR} \!= \!1.4 \times 10^{-28} L_{\lambda}[{\rm erg\,s}^{-1}{\rm Hz}^{-1}]\,{\rm at\,}\lambda=150\,{\rm nm}\,{\rm and\,}\lambda=280\,{\rm nm}. \end{eqnarray*}](/articles/aa/full_html/2013/08/aa21054-13/aa21054-13-eq108.png) Furthermore, Popescu et al. (2000) assumed that a fraction yUV of the non-ionising UV is absorbed in star-forming complexes (e.g. HII regions). They fit the FIR SED to the observational data and find a value SFR = 3.5 M⊙/yr and yUV = 0.28 for NGC 891. As per Popescu et al. (2000) we assume that the young stellar population has a scaleheight of zUV = 90 pc and a scalelength similar to that of the disk in the blue-band (i.e. hUV = 5.67 kpc). From the SFR – luminosity relations, using Eq. (7) and assuming yUV = 0.28 we calculate the stellar emissivity at wavelengths λ = 91.2,150 and 280 nm:
Furthermore, Popescu et al. (2000) assumed that a fraction yUV of the non-ionising UV is absorbed in star-forming complexes (e.g. HII regions). They fit the FIR SED to the observational data and find a value SFR = 3.5 M⊙/yr and yUV = 0.28 for NGC 891. As per Popescu et al. (2000) we assume that the young stellar population has a scaleheight of zUV = 90 pc and a scalelength similar to that of the disk in the blue-band (i.e. hUV = 5.67 kpc). From the SFR – luminosity relations, using Eq. (7) and assuming yUV = 0.28 we calculate the stellar emissivity at wavelengths λ = 91.2,150 and 280 nm: ![Mathematical equation: \begin{equation} L_{\rm s} \left[\frac{\rm erg}{{\rm s}\,{\rm pc}^3\,{\rm sr}\,{\rm nm}} \times 10^{29}\right] = \begin{cases} 2.45 & \text{for } \lambda = 91.2\,{\rm nm},\\ 5.25 & \text{for } \lambda = 150\,{\rm nm},\\ 1.51 & \text{for } \lambda = 280\,{\rm nm}. \end{cases} \end{equation}](/articles/aa/full_html/2013/08/aa21054-13/aa21054-13-eq116.png) (11)We now need to calculate the radiation field that dust would experience at each point in the galaxy NGC 891. To do this, we use the method described by Dasyra et al. (2005) (see also Misiriotis et al. 2006). Given the parameters of the stellar and dust distributions, we calculate the radiation field at a given point inside the galaxy taking into account both the effects of absorption and multiple scattering by dust and the subsequent re-emission at FIR/submm wavelengths.
(11)We now need to calculate the radiation field that dust would experience at each point in the galaxy NGC 891. To do this, we use the method described by Dasyra et al. (2005) (see also Misiriotis et al. 2006). Given the parameters of the stellar and dust distributions, we calculate the radiation field at a given point inside the galaxy taking into account both the effects of absorption and multiple scattering by dust and the subsequent re-emission at FIR/submm wavelengths.
We compare our model with the more sophisticated TRADING model (Bianchi 2008; Bianchi & Xilouris 2011) based on Monte Carlo (MC) simulations. The TRADING model of NGC 891 has been derived from the geometric properties and dust opacities obtained by Xilouris et al. (1999). For the intrinsic stellar spectrum a template for an Sb galaxy was used, scaled to match available NIR/optical/UV fluxes. As per Popescu et al. (2000), an additional dust component was included to fit the observed FIR/submm SED. In the TRADING model, this component is in the form of an exponential disk distribution of spherical (molecular) clouds, heated internally by a UV-dominated radiation field from young stars. In Bianchi & Xilouris (2011) the model was fine-tuned to match both the global SED and the spatial distribution of the dust emission observed by the Herschel Space Observatory.
 |
Fig. 3 Integrated radiation field J [erg s-1 cm-2 sr-1] as a function of the distance from the galactic plane for R = 1,2,3 hs (dotted, solid and dashed lines respectively) where hs = 5.6 kpc. Red lines show the radiation field obtained with the TRADING model while black lines correspond to the model described in this paper. |
Figure 3 presents the radiation field integrated over the wavelengths J [erg s-1 cm-2 sr-1] as a function of the distance from the galactic plane, z, for a radial distance R = 1,2,3 hs (dotted, solid and dashed lines respectively) where hs = 5.6 kpc. Red lines show the TRADING model results, black lines show the model described in this paper. We notice a different behaviour between the two models for the radiation field at R = 3 hs. This is due to the fact that in the TRADING model there is a cutoff in the stellar distribution at about R = 13 kpc which is necessary to fit the dust SED with the observations while in the model described in this paper we set a cutoff at 3 hd ~ 24 kpc.
Figure 4 shows the spectral distribution of the radiation field λJλ (red lines: TRADING model, black lines: our model and green line: Mathis et al. 1983) for a radial distance R = 2 hs ≈ 11 kpc and for vertical distances z = 0,8,22 kpc (from top to bottom). In order to compare the radiation field that we calculate in this paper with the radiation field in the solar vicinity we use the parameter G0:  (12)The value of G0 at (R [kpc], z [kpc]) = (11,0) for our model is G0 = 1.47. The green line in Fig. 4 refers to the radiation field in the solar vicinity but rescaled imposing the same G0 calculated above. We notice that the shape of the radiation field in the solar vicinity is similar to the radiation field we calculate for NGC 891. In our model we compute the radiation field only up to the K band, while in the solar vicinity the radiation field is known up to 105 μm. This does not affect the resulting SED since most of the emitted power is in the range 0.091−0.25 μm.
 |
Fig. 4 Spectral energy distribution of the radiation field λJλ for R = 11 kpc and for z = 0,8,22 kpc (from top to bottom). Red lines represent the radiation field obtained with the TRADING model, black lines represent the model described in this paper and the green line represents the galactic radiation field in the solar vicinity obtained by Mathis et al. (1983) rescaled to have the same G0 that we obtain in our model at (R [kpc], z [kpc]) = (11,0). |
The plot in Fig. 5 shows the value of G0 as a function of the distance from the galactic plane at a radial distance R = 0 kpc (dotted line) and R = 22 kpc (solid line) as calculated by our model.
 |
Fig. 5 G0 as a function of the distance from the galactic plane for a radial distance R = 0 kpc (dotted line) and R = 22 kpc (solid line) as calculated by our model. |
5. PAH dissociation probability
As a consequence of the absorption of a photon or a collision with an electron, the internal energy of a PAH increases and this leads to the excitation of the entire molecule. The energy transferred to the molecule is spread over the vibrational modes and can lead to the dissociation of the molecule or to radiative relaxation.
In this study we are interested in the emission, for a given dust distribution, in different environments and for now we neglect time dependent effects. To do this, we estimate the probability that a PAH will dissociate before it can emit a sufficient amount of the absorbed energy as IR photons (dissociation probability). If this probability in a given environment is high then destruction dominates over radiative relaxation and we are unlikely to detect the emission from a PAH of this size in this environment. The dissociation probability varies with the size of the PAH. For large molecules the transferred energy can be spread over a larger number of vibrational modes and therefore the dissociation probability for a big molecule is lower than that for a smaller molecule. We set the probability threshold at 0.01. A molecule with a dissociation probability equal to the probability threshold will be the smallest molecule considered in the size distribution, molecules smaller than this are assumed to be quickly destroyed and unable to emit enough to be detected.
We use the approach developed by Micelotta et al. (2010). What is important in this approach is that, for the grain that we consider, the time between two collisions is longer than the time needed to cool down. We verify this assumption in Sect. 8. We treat the problem in the microcanonical ensemble, the transferred energy, Etr, is related to the effective internal energy of the system, Eeff, by: 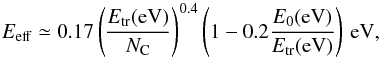 (13)where E0 is the binding energy of the fragment, which we set equal to 4.6 eV as a standard value (Micelotta et al. 2010). Then the unimolecular dissociation rate, kdiss, written in Arrhenius form is given by:
 ![Mathematical equation: \begin{equation} k_{\rm diss} = k_0(E_{\rm eff}) \exp \left[ -E_0/E_{\rm eff} \right], \end{equation}](/articles/aa/full_html/2013/08/aa21054-13/aa21054-13-eq138.png) (14)where k0 has a weak dependency on the internal energy and in this calculation is considered constant and equal to 1.4 × 10¹⁶ s-1. As per Micelotta et al. (2010), we consider that each emitted photon has an energy Δϵ = 0.16 eV and that the maximum number of photons emitted scales with the number of carbon atoms, NC, in the PAH as nmax = NC/5. This leads to Eq. (17) in Micelotta et al. (2010):
(14)where k0 has a weak dependency on the internal energy and in this calculation is considered constant and equal to 1.4 × 10¹⁶ s-1. As per Micelotta et al. (2010), we consider that each emitted photon has an energy Δϵ = 0.16 eV and that the maximum number of photons emitted scales with the number of carbon atoms, NC, in the PAH as nmax = NC/5. This leads to Eq. (17) in Micelotta et al. (2010): 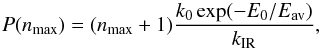 (15)where P(nmax) is the total un-normalized dissociation probability after the ejection of nmax photons, the average temperature, Eav, is chosen as the geometric mean (
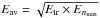 ), Enmax = (Etr − nmax × Δϵ) and kIR is assumed to be 100 photons s-1 (Jochims et al. 1994). We apply this method to put a lower limit on the dust population sizes for both photon and electron collisional heating.
Considering only photon heating in the solar vicinity, the transferred energy, Etr is the energy of the single absorbed photon. For a given Etr we can calculate the corresponding P(nmax). We then need to average P(nmax) over the interstellar radiation field (ISRF) distribution as follows: 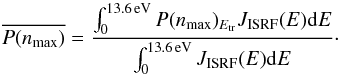 (16)This leads to a probability lower than 0.01 only for PAHs with NC ≳ 30, which is in accordance with previous estimates (Jochims et al. 1994).
We now consider electron collisional heating. In this case Etr = ζ(E)E and we need to average P(nmax) over the Maxwell-Boltzmann distribution, fM(E): 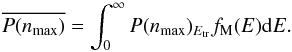 (17)For example, if we take a gas temperature Tgas = 106 − 107 K, the transferred energy is much higher than in the case of photon absorption and this method leads to a size limit of NC ≈ 200. This size limitation can be applied to both PAHs and hydrogenated amorphous carbon, a-C(:H), grains since the structure of the small a-C(:H) grains is very close to that of the PAHs, i.e. they are both highly aromatic (Jones 2012). This number of carbon atoms corresponds to a PAH of radius a ≈ 0.77 nm and an a-C:H grain of radius a ≈ 0.82 nm with the density and the geometry (both PAHs and a-C:H grains considered as spherical) used in the Compiègne et al. (2011) dust model. As shown by Bocchio et al. (2012) the 2D and 3D grain approaches are equivalent up to radii as large as ≈5 nm.
6. Grain charge effects
The effect of grain charging in such a hot and tenuous medium has been studied by Draine & Salpeter (1979). For temperatures Tgas ~ 106 − 107 K the charging due to the emission of secondary electrons is more important than the charging due to photoelectric effect and can lead very quickly to high electric potentials (e.g., ~30 V). In the case of small grains, they will be quickly destroyed by the field ion emission process. On the other hand, the Coulomb focusing effect is not important at these high temperatures because the electrostatic energy of the grain is always much smaller than the gas thermal energy.
We give an estimate of the timescale needed for a small grain (a = 1 nm) to reach a potential of 30 V in a gas at Tgas ~ 107 K and nH = 10-3 cm-3. The timescale between two collisions with an electron can be expressed as:  (18)where σ = πa2 = π × 10-14 cm2, and
  cm/s. This leads to a timescale τcoll ≈ 0.6 yr. To obtain the timescale for the grain to reach the potential of 30 V we need to multiply our result by the yield (Ysec following Draine & Salpeter 1979 is approximately unity) and by the number of electrons that we need to extract (~70 e−). Therefore the time needed for a small grain to be torn apart by field ion emission is about τfie ≈ 40 yr. Given that this timescale is so short we can consider these grains to be instantaneously destroyed.
Draine & Salpeter (1979) calculated the minimum grain radius that will not be destroyed by the high electric potential. For Tgas = 107 K, nH = 10-3 cm-3 and assuming a maximum effective tensile stress of 7 × 10¹⁰ dyne cm-2, the minimum grain radius allowed is amin ≈ 2 nm.
The effect of grain charge in such a high temperature gas is therefore critical for small grains and will therefore be explored in detail in a future study.
The effect of charging due to the absorption of the X-ray photons produced in such a hot and tenuous medium was taken into account by Draine & Salpeter (1979) and was considered to be completely negligible with respect to the effect of charging due to secondary electron emission.
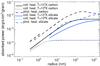 |
Fig. 6 Power absorbed per unit area per grain due to photon and collisional heating at z = 0 and R = 14 kpc in NGC 891, where, according to our model, G0 = 1. The collisional heating has been computed as if the plane of the galaxy was consisted of a hot gas with T = 106 and 107 K and for nH = 10-3 cm-3. In the three black lines there is a discontinuity around 1 nm because of the transition between PAHs and a-C:H grains. |
7. Photon vs. electron collisional heating
In this work we use the Compiègne et al. (2011) dust model where all of the molecules and grains are considered to be spherical. We compare the two dust heating processes: collisions with electrons and the absorption of photons. In Fig. 6 we show the absorbed energy per unit area per grain due to photon and collisional heating as a function of the grain/molecule radius. This plot refers to the point (R [kpc], z [kpc]) = (14, 0) in the galaxy NGC 891 where, according to our model, G0 = 1. The electron collisional heating has been calculated as if the plane of the galaxy contains only a hot gas with T = 106 − 107 K and nH = 10-3 cm-3. The discontinuity in the black lines around a ~ 1 nm is due to the transition between PAHs and a-C:H grains.
We notice that in the case of a gas temperature of 106 K the electron collisional heating for carbonaceous and silicate grains are very close to one other. This is because the peak of the Maxwell-Boltzmann distribution, corresponding to Tgas = 106 K, is in the linear portion of the transferred energy function for both silicates and carbonaceous grains. This is not the case for Tgas = 107 K, where the electron energy can be higher than the threshold of the transferred energy function. Furthermore, in the latter case, the electron collisional heating is less than an order of magnitude lower than the photon heating for each of the sizes.
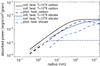 |
Fig. 7 Power absorbed per unit area per grain due to photon and collisional heating at z = 3.5 kpc and R = 22 kpc in NGC 891, where, according to our model, G0 = 0.1. The collisional heating has been computed for IGM gas with a temperature Tgas = 106 and 107 K and a proton density nH = 10-3 cm-3. In the three black lines there is a discontinuity around 1 nm because of the transition between PAHs and a-C:H grains. |
From Fig. 5 we have that G0 is about 0.1 at (R [kpc], z [kpc]) = (22, 3.5). Therefore photon heating should be an order of magnitude lower than in the previous case and should be comparable with the collisional heating. Figure 7 represents the power absorbed per unit area per grain due to both photon absorption and collisional heating in the galaxy NGC 891 at (R [kpc], z [kpc]) = (22, 3.5) where G0 ≈ 0.1. We notice that, in this region, the collisional heating is larger than the photon heating and therefore must be taken into account. Thus, at relatively large vertical distances above the plane of a galaxy, electron collisional heating could be as important, or more important than, photon heating. However, far from a galaxy, in the IGM, it is likely that dust may not survive long (e.g. Bocchio et al. 2012) and because of this we are currently evaluating the gas and dust dynamics during the ram pressure stripping.
8. DustEM code
The DustEM code is a numerical tool presented by Compiègne et al. (2011), which calculates the dust SED for a given dust model and given ISRF. We have now included in DustEM the heating of dust due to collisions with electrons (see Appendix A for details). The corresponding power (Eq. (1)) is added to the photon heating power and the grain temperature distribution is derived using the method described by Désert et al. (1986).
Even if DustEM calculates the grain temperature distribution for each grain size, it is important to know if a grain of a given size in a certain environment is stochastically heated or is in thermal equilibrium. For example, to estimate the PAH dissociation probability in Sect. 5, we implicitly assumed that PAHs are not in thermal equilibrium but that they experience significant temperature fluctuations. First of all, we need to calculate the average time between the absorption of two photons, τabs, and the average time between two collisions with electrons, τcoll. Then we need to compare these average times with the cooling time, τcool. If the cooling time is larger than the time between collisions or photon absorptions, then the grain will tend to a thermal equilibrium, otherwise it will be stochastically heated.
The average time between the absorption of two photons is given by:  (19)where πa2Qλ is the absorption cross section for a given wavelength λ. The average time between collisions with electrons is given by:
  (20)where me is the electron mass.
As a consequence of the absorption of the most energetic photons or the most energetic collisions with the electrons2, the internal energy of a grain will increase and its temperature will reach the highest value Tmax. We define the cooling time as the time needed to cool down from the temperature Tmax to a temperature where the radiative emission is negligible with respect to the radiative emission at the highest temperature. We calculate the highest temperature reached by a grain as a consequence of the injection (due to photon absorption of collisional heating) of an energy Ein by:  (21)As given by Dwek (1986) we can write that, between two heating events, a grain cools at a rate:
  (22)where Ld is the the rate at which a dust particle radiates:
 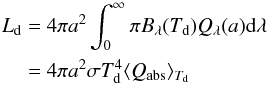 (23)with Bλ the Planck function, σ the Stefan-Boltzmann constant and ⟨ Qabs ⟩ Td the Planck-averaged value of Qλ(a). Following this approach, the cooling time can be written as:
 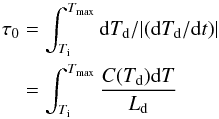 (24)where Ti is the initial temperature of the grain (Ti = 0.1 K in DustEM code). We note that this definition of the cooling time depends on the value of the minimum temperature of the grain and is dominated by the time spent close to the lowest temperatures. We therefore define the cooling time in this way:
 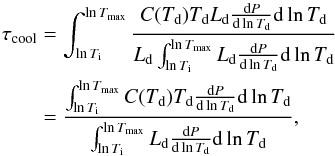 (25)where
  is the probability for a grain to be at a certain temperature. In this way, τcool is not sensitive to the minimum temperature that we consider and represents the time needed for a grain to cool to a temperature where the radiative emission is negligible with respect to the radiative emission at the maximum temperature. If we consider the electron collisional heating only we call the cooling time τcool(coll), while if only the photon heating is present we call the cooling time τcool(ph).
In Fig. 8 we show τcoll, τabs, τcool(coll) and τcool(ph). There is a discontinuity in the cooling time at a size of about a ≈ 1 nm because of the transition between the PAHs and a-C:H grains. The other two small discontinuities at a ≈ 4 nm and a ≈ 20 nm are due to small differences in the adopted size distributions (power law and log normal) of a-C:H grains. We notice that for a grain of about a1 ≈ 7 nm, the cooling time, in the case of photon heating only, equals the absorption time. This means that, if we assume no collisional heating, grains with radii smaller than a1 are stochastically heated, while larger grains tend to be in thermal equilibrium. If we consider the electron collisional heating only, the intersection between the two curves corresponds to a grain radius a2 ≈ 27 nm. When both processes occur, the average cooling time is very similar to the cooling time in the case of photon heating only, because the collision with an electron, for each of the grain sizes, is much rarer than the absorption of a photon. The average time between two events (be they electron collisions or photon absorptions) can be calculated as follow (if they are independent, which is the case here): 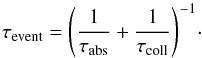 (26)Since electron collisions are much rarer than photon absorptions τevent ≈ τabs and therefore the intersection between the two lines corresponding to the cooling time, and average time between two events, would be at around aboth ≈ 7 nm. In Sect. 5 we made the assumption that a-C:H grains smaller than NC ≈ 200 (corresponding to aa − C:H = 0.77 nm) were stochastically heated. We therefore confirm that this assumption is valid.
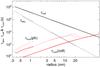 |
Fig. 8 Photon absorption time (τabs), electron collision time (τcoll) and cooling times (τcool(coll) and τcool(ph)) for carbonaceous grains with radius from 0.3 to 30 nm. In the case of photon absorption, we assume a radiation field with G0 = 1, while in the case of electron collisions, Tgas = 107 K and nH = 10-3 cm-3 have been assumed. τcool(coll) represents the cooling time in the case of collisional heating only whilst τcool(ph) represents the cooling time in the case of photon absorption only. In all the three lines there is a discontinuity between 0.6 nm and 1.2 nm because of the transition between PAHs and a-C:H grains. |
Using DustEM we obtain the dust temperature distribution for each grain size. We consider a small PAH (a = 0.77 nm) and we compare the temperature distribution in the case of photon heating, collisional heating or both processes. As we can see in Fig. 8 such a grain is stochastically heated in all cases. This is confirmed by the shape of the temperature distributions in Fig. 9, which shows the probability for a grain to be at a certain temperature (dP/dlnT) with respect to the range of temperatures that the grains can assume. We assume a gas temperature Tgas = 107 K, a gas proton density nH = 10-3 cm-3 and G0 = 1. We notice that, for most temperatures, we have: dP/dlnT (collision + photon) = dP/dlnT (collision) + dP/dlnT (photon).
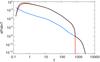 |
Fig. 9 dP/dlnT (probability for a grain to be at a certain temperature) in the case of a stochastically-heated PAH molecule (radius a = 0.765 nm) assuming a gas temperature Tgas = 107 K, a gas proton density nH = 10-3 cm-3 and G0 = 1. We notice that the probability distribution in the case of dust heating due to both collisions and photon absorption (black line) is, for most of the temperatures, the sum of the probability distribution due to only photon heating (red line) and the probability distribution due to collisional heating (blue line). |
If we consider a grain that is large enough to be in thermal equilibrium with collisional heating only, then in this case we can analytically calculate the equilibrium temperature, equating the rate of absorbed energy H (see Eq. (1)), to the rate at which a dust particle radiates, Ld (see Eq. (23)). If we assume Qλ ~ λ− β, where β is the opacity power law index (in our case β ≈ 1.55, see Compiègne et al. 2011), the predicted equilibrium temperature is: 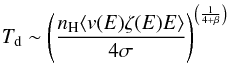 (27)where the averaging is over the Maxwell-Boltzmann distribution. We consider for example a grain of radius a = 0.32 μm and look at the equilibrium temperature for nH = 10-4 − 10-1 cm-3. We can fit the obtained values with a power law and obtain:
 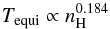 (28)In Fig. 10 we show the equilibrium temperature with respect to the proton density of the gas. The black plus signs represent the values obtained with DustEM (with the method described by Désert et al. 1986) while the red line is the fit to these values given by Eq. (28). The value of the exponent, γDustEM = 0.184, is close to what we would expect analytically, γth = 0.180, they differ by only 2%. This small difference can be explained by the fact that DustEM considers a temperature distribution rather than single equilibrium temperature and the parameter β is not exactly 1.55 as assumed in the analytical approximation.
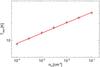 |
Fig. 10 Equilibrium temperature, Tequi, with respect to the proton density, nH, for a gas temperature Tgas = 107 K and for a grain of radius a = 0.32 μm, heated only by electron collisions. The black plus signs have been obtained with DustEM and the red line is the straight line fit to these values ( |

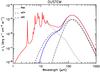 |
Fig. 11 Dust SED for G0 = 1 in the region (R [kpc], z [kpc]) = (14, 0) in the galaxy NGC 891 for an assumed column density NH = 1020 cm-2. The red and blue lines represent the SED due to photon heating only, with (blue line) and without (red line) the size limitation at amin = 2 nm caused by the presence of a gas at Tgas = 107 K and nH = 10-3 cm-3. Black lines represent the various contribution to the SED shown by the red line. |
9. Results
We apply the present model to the region (R [kpc], z [kpc]) = (14,0) in NGC 891 where, following the method described above, G0 = 1. The plot in Fig. 11 shows the dust SED calculated with DustEM due to only photon heating without (red line) and with (blue line) the size limitation (in the PAH and a-C:H size distributions) at amin = 2 nm (added to show the destructive effect in the case of the presence of a hot gas). The silicate grains considered in the Compiègne et al. (2011) model are big enough (a(min, sil.) = 4 nm) to be unaffected by destruction during heating so no change in the lower limit of the size distribution has been imposed on this population.
The black lines show the different contributions to the SED calculated without any size limitation. The black dash-dotted line represents the contribution to the SED coming from silicate grains, the dotted line represents the contribution due to PAH emission, the dashed line represents the contribution from the a-C:H grains while the red line represents the total dust SED (we keep the same style-color coding for all of the SEDs plotted in this paper). Including electron collisional heating in this case would not affect the result, as it is negligible with respect to the photon heating (see Fig. 6). We note that the grain size limitation, imposed as a consequence of grain charging effects leading to destruction, has a major effect on the emission features, in particular since all the PAHs are quickly destroyed, there is no evidence for any PAH features in the dust SED (blue line).
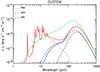 |
Fig. 12 Dust SED for G0 = 0.1, in the region (R [kpc], z [kpc]) = (22, 3.5) in the galaxy NGC 891. The red and blue lines represent the SED due to photon heating only, with (blue line) and without (red line) the size limitation at amin = 2 nm. The green line represents the SED due to both photon and collisional heating with the size limitation at amin = 2 nm (we assume the totality of the dust as embedded in the hot gas). Black lines represent the various contribution to the SED shown by the red line. We assume the same column density and gas properties as in Fig. 11. |
The plot in Fig. 12 shows the SED in the region (R [kpc], z [kpc]) = (22, 3.5) in the galaxy NGC 891. Following our method, in this region we have a radiation field with G0 = 0.1. The red line shows the SED in the case of photon heating only and with no evolution of the smallest particles. The blue line shows the SED due to only photon heating as in the case of the red line but we here impose a cut in the size distribution at amin = 2 nm given by the destructive effect of a hot gas. The green line shows the SED as in the case of the blue line but with the addition of electron collisional heating, as in the case of an IGM gas (Tgas, nH) = (107 K, 10-3 cm-3). The black lines represents the contributions to the red line.
Comparing the green and blue lines in Fig. 12 it is clear that the short wavelength emission (λ < 10 μm) from a hot tenuous gas with low G0 can come only from the electron collisional heating of larger grains (a > 2 nm), or equivalently we can say that the ISRF does not have sufficiently high energy photons to heat small grains to high enough temperatures to produce this short wavelength emission. Also, the mid- and far-IR emission are significantly enhanced by the inclusion of electron collisional heating.
Since the value of amin depends not only on the properties of the gas where dust is embedded, but also on the dynamics of dust in this medium, we plot in Fig. 13 the resulting dust SED (for G0 = 0.1, Tgas = 107 K and nH = 10-3 cm-3) for different values of amin, ranging from 0.77 to 5 nm. We notice that the dust SED presents PAH features only for amin = 0.77 nm because the other values of amin are larger than that of the PAHs in our model.
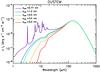 |
Fig. 13 Dust SED due to both photon (G0 = 0.1) and electron collisional heating (nH = 10-3 cm-3, Tgas = 107 K) for different values of amin. |
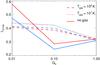 |
Fig. 14 Ratio I70/100 computed for the Compiègne et al. (2011) dust model (red lines) and for the Draine & Li (2007) dust model (blue lines). The gas proton density is kept constant at nH = 10-3 cm-3, the solid lines represent the case of the absence of collisional heating and destruction, while the dotted lines and the dashed lines correspond to a gas temperature of Tgas = 107 K and Tgas = 108 K respectively. |
10. Astrophysical implications
From this work it is clear that the inclusion of electron collisional heating and grain charge effects lead to significant changes in the shape of the IR-mm SED (green and red lines in Fig. 12). The most obvious effect is the complete loss of the aromatic emission bands, in the 3−20 μm wavelength region, due to the destruction of the PAHs. Here this effect is modeled by increasing the minimum grain radius to 2 nm, which is larger than that of PAHs (see Table 1). This result is consistent with the Micelotta et al. (2010) and Bocchio et al. (2012) results but we find that, with the inclusion of grain charge processes, the destructive effect of a hot gas on small particles (a ~ 1 − 3 nm) is even more important than in their work.
The next most obvious effect of including electron collisional heating, in a low density and weak radiation field environment, is a shift in the peak wavelength of the big grain emission, from ~ 200 μm (T ~ 15 K) to ~130 μm (T ~ 23 K), and the appearance of the emission bands at 10 and 18 μm due to small, hot silicate grains.
We also note that there is an important change in the slope of the dust SED between 70 μm and 100 μm, which is not affected by small grain size cut-off in our model. We have calculated the PACS 70 μm to 100 μm band ratio, I70/100, as a function of G0 both with and without electron collisional heating. In Fig. 14 we plot I70/100 for the Compiègne et al. (2011) dust model (red lines) and the Draine & Li (2007) dust model (blue lines) as a function of G0. The gas proton density is kept constant at nH = 10-3 cm-3, the solid lines represent the case where collisional heating and destruction are ignored (no gas), while the dotted lines and the dashed lines correspond to a gas temperature of Tgas = 107 K and Tgas = 108 K, respectively. We note that the ratio I70/100 is significantly affected by the presence of a hot gas for G0 = 0.1. The introduction of dust heating and grain charge destruction effects arising from electron collisions in a hot gas leads to changes in I70/100 that could be a good SED diagnostic signature of the presence of a hot gas and a weak radiation field (G0 ~ 0.1). Furthermore we note that the two dust models predict very similar SEDs for wavelengths longer than 10 μm, i.e. they show the same behaviour (the red and blue lines in Fig. 14), with respect to G0, therefore indicating the robustness of our results.
From Figs. 12 and 13 we notice that, regardless the value of amin we choose in our model, there is a change in the slope between 24 μm and 70 μm. We have therefore calculated the MIPS 24 μm to PACS 70 μm band ratio (I24/70) for different G0 and we plot this in Fig. 15 for the Compiègne et al. (2011) dust model and the Draine & Li (2007) dust model. We use the same style-color code as in Fig. 14. Since in the case of a hot gas electron collisions also destroy the small grains, we therefore calculated the ratio I24/70 for the different values of amin shown in Fig. 13. This range of possible values of amin gives rise to a variability of the ratio I24/70 of ± 50%, which is shown in Fig. 15 by the two shaded regions (light blue for Tgas = 107 K and orange for Tgas = 108 K). Despite the variability of I24/70 for low G0, this band ratio could be, together with I70/100, a good SED diagnostic signature of the presence of a hot gas acting on dust grains through both electron collisional heating and dust destruction.
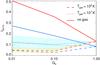 |
Fig. 15 Same as Fig. 14 but for the ratio I24/70. The two shaded regions represent the variability in the ratio I24/70 due to the uncertainty on amin (see Fig. 13) for our model. |
It is clear that PAH-sized particles ought to be destroyed in a hot gas through effects arising from extreme charging processes (secondary electron emission, field ion emission and/or Coulomb explosion) on timescales of the order of tens of years (see Sect. 6). Given that this time-scale is so short the aromatic band emission from the outer regions of the entrained clumps will be of extremely limited spatial extent and therefore hard to detect. Therefore any observation of the aromatic emission bands in the SEDs of dust in the IGM local to galaxies would imply very large quantities of dust and gas embedded within entrained dense clumps immersed in the hot gas. These clumps will probably be in pressure equilibrium with the coronal-type IGM gas (nHT ~ 104 K cm-3) if they have densities and temperatures of either the warm inter-cloud medium or the cold neutral medium of the galaxy. However, dynamical processes such as conduction or ablation in the outflowing gas will lead to their eventual evaporation. Any aromatic band emission should therefore come from the shells or halos around embedded clumps, the thickness of which will depend upon the local dynamical conditions and so it is difficult to generalize on the observability of aromatic emission bands in the IGM. Nevertheless, if we consider a dense clump in pressure equilibrium with the hot coronal-type IGM gas (nHT ~ 104 K cm-3) we can estimate the lifetime of small grains for different shell conditions around dense clumps with Tclump = 102 K and nH = 102 cm-3. In Fig. 16 we plot the lifetime of grains as a function of size for different gas temperatures. Note that since the shells are assumed to be in pressure equilibrium with the IGM gas, fixing the temperature in a given shell, fixes the proton density as well. In Fig. 16 the the abrupt drop at 2 and 3 nm, for temperatures of 107 and 108 K respectively, is due to the effect of Coulomb explosion/ion field emission, which play an important role in dust destruction leading to even shorter lifetimes than those predicted by Micelotta et al. (2010) and Bocchio et al. (2012).
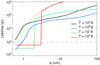 |
Fig. 16 Lifetime of carbonaceous grains as a function of the grain size for different gas temperatures. The abrupt drop in the lifetime for the red and green curves is due to ion field emission. The dotted lines represent the lifetime of dust without the inclusion of any charge effect. The dashed horizontal line at 102 yr represents the threshold for observability. |
We find that emission from grains smaller than 2−3 nm will be difficult to detect in the IGM near and far from galaxies because the small particle destruction time is rather short. On the other hand, if we assume that in order to be observable a grain must have a lifetime >102 yr, then, in the lower density evaporating regions around entrained clumps, emission from grains larger than 2−3 nm ought to be observable in a gas with nHT ~ 104 K cm-3. We note that shells with Tgas < 105 K the dust lifetime is ≫108 yr. Furthermore, if the evaporation dynamics of these dense clumps is fast, as we clearly see from Fig. 16, then we could observe dust emission from larger grains (a ≳ 3 nm) even in a hot and diffuse gas at Tgas = 108 K and nH = 10-4 cm-3.
In conclusion, a consideration of the grain charging processes acting on dust embedded within a hot gas, whether in the hot gas itself or ablated from entrained, dense clumps, turns out to be absolutely critical in determining their destruction time-scale and hence their observability.
11. Conclusions
In hot coronal type gas, for high gas temperatures Tgas = 107 − 108 K, the collisions between dust and fast electrons can lead to the heating, destruction and charging of grains. As we have shown, these three processes dramatically affect the dust SED.
In the case of a hot and tenuous gas with (nH, Tgas) = (10-3 cm-3, 107 K), the power absorbed per grain is comparable to the power absorbed per grain due to photon heating in a region where G0 ≈ 0.1. In this environment, we calculate that the charging due to emission of secondary electrons is important and leads to high electric potentials, therefore destroying the smallest grains (a < 2 nm) very quickly. We set the size distribution lower limit to a = 2 nm but we do explore the changes in the SED due to the uncertainty of this parameter. This change in the size distribution, together with the extra energy input due to electron collisions, leads to important differences in the mid- and far-IR part of the SED. In particular, including electron collisional heating leads to an enhancement in the ratio I70/100 with respect to the case of photon heating only in weak radiation fields (with G0 = 0.1).
In our model we treated the problem in a stationary way: in the case of the presence of a hot gas, we derive a lower limit to the size distribution, which is determined by the radius where the grains are too small to survive long enough to be detected. However, a full analysis really needs to take into account the time dependency of the dust population evolution, which can be calculated at each instant using the destruction rates given by Bocchio et al. (2012) (with charge effects included), and the relevant dust dynamics.
In the case of ram pressure stripped galaxies, our results for the electron collisional heating and collisional destruction represent an upper limit because we assumed that dust was embedded in the IGM gas. In reality the dust could be embedded in a gas which is a mix of IGM gas and HI gas ejected from the stripped galaxy. Therefore a detailed analysis of the dynamics of dust and gas coupling resulting from extragalactic halo formation during ram pressure stripping needs to be undertaken on a case by case basis. We plan to do this in a future paper.
The most energetic collisions with the electrons correspond, for a given size, to the maximum deposited energy i.e. the maximum of the transferred energy function Eζ(E).
Acknowledgments
M.B. and E.M.X. wish to acknowledge Kalliopi Dasyra for the development of the code (Misiriotis et al. 2006) used to calculate the radiation field around NGC 891. We wish to thank our referee A.G.G.M. Tielens for a careful reading and many helpful remarks.
References
- Alton, P. B., Bianchi, S., Rand, R. J., et al. 1998, ApJ, 507, L125 [NASA ADS] [CrossRef] [Google Scholar]
- Berger, M. J., & Seltzer, S. M. 1964, NASA SP, 3012 [Google Scholar]
- Bianchi, S. 2008, A&A, 490, 461 [NASA ADS] [CrossRef] [EDP Sciences] [Google Scholar]
- Bianchi, S., & Xilouris, E. M. 2011, A&A, 531, L11 [NASA ADS] [CrossRef] [EDP Sciences] [Google Scholar]
- Bocchio, M., Micelotta, E. R., Gautier, A.-L., & Jones, A. P. 2012, A&A, 545, A124 [NASA ADS] [CrossRef] [EDP Sciences] [Google Scholar]
- Christensen, J. H. 1990, MNRAS, 246, 535 [NASA ADS] [Google Scholar]
- Compiègne, M., Verstraete, L., Jones, A., et al. 2011, A&A, 525, A103 [NASA ADS] [CrossRef] [EDP Sciences] [Google Scholar]
- Cortese, L., Davies, J. I., Pohlen, M., et al. 2010, A&A, 518, L49 [NASA ADS] [CrossRef] [EDP Sciences] [Google Scholar]
- Dasyra, K. M., Xilouris, E. M., Misiriotis, A., & Kylafis, N. D. 2005, A&A, 437, 447 [NASA ADS] [CrossRef] [EDP Sciences] [Google Scholar]
- Désert, F. X., Boulanger, F., & Shore, S. N. 1986, A&A, 160, 295 [NASA ADS] [Google Scholar]
- Draine, B. T., & Li, A. 2007, ApJ, 657, 810 [NASA ADS] [CrossRef] [Google Scholar]
- Draine, B. T., & Salpeter, E. E. 1979, ApJ, 231, 77 [NASA ADS] [CrossRef] [Google Scholar]
- Dwek, E. 1986, ApJ, 302, 363 [NASA ADS] [CrossRef] [Google Scholar]
- Dwek, E. 1987, ApJ, 322, 812 [NASA ADS] [CrossRef] [Google Scholar]
- Fioc, M., & Rocca-Volmerange, B. 1997, A&A, 326, 950 [NASA ADS] [Google Scholar]
- Iskef, H., Cunningham, J. W., & Watt, D. E. 1983, Phys. Med. Biol., 28, 535 [CrossRef] [Google Scholar]
- Jochims, H. W., Ruhl, E., Baumgartel, H., Tobita, S., & Leach, S. 1994, ApJ, 420, 307 [NASA ADS] [CrossRef] [Google Scholar]
- Jones, A. P. 2012, A&A, 542, A98 [NASA ADS] [CrossRef] [EDP Sciences] [Google Scholar]
- Joy, D. C. 1995, Scanning, 17, 270 [CrossRef] [Google Scholar]
- Mathis, J. S., Mezger, P. G., & Panagia, N. 1983, A&A, 128, 212 [NASA ADS] [Google Scholar]
- Micelotta, E. R., Jones, A. P., & Tielens, A. G. G. M. 2010, A&A, 510, A37 [NASA ADS] [CrossRef] [EDP Sciences] [Google Scholar]
- Misiriotis, A., Papadakis, I. E., Kylafis, N. D., & Papamastorakis, J. 2004, A&A, 417, 39 [NASA ADS] [CrossRef] [EDP Sciences] [Google Scholar]
- Misiriotis, A., Xilouris, E. M., Papamastorakis, J., Boumis, P., & Goudis, C. D. 2006, A&A, 459, 113 [NASA ADS] [CrossRef] [EDP Sciences] [Google Scholar]
- Popescu, C. C., Misiriotis, A., Kylafis, N. D., Tuffs, R. J., & Fischera, J. 2000, A&A, 362, 138 [NASA ADS] [Google Scholar]
- Xilouris, E. M., Byun, Y. I., Kylafis, N. D., Paleologou, E. V., & Papamastorakis, J. 1999, A&A, 344, 868 [NASA ADS] [Google Scholar]
Appendix A: Upgrades to DustEM
In the DustEM model version 4.0, the only source of heating is the absorption of photons. As we have seen, in the IGM, electron collisional heating can play an important role and can be also more important than the photon heating.
In addition to the already present photon heating we implemented an electron collisional heating routine (DM_get_collheat) in the model. In this routine we evaluate the power absorbed per grain due to collisions between grains and electrons as described in Sect. 3.
The routine DM_get_collheat is then called in the routine DM_get_tdist, responsible for the calculation of the temperature distribution. This latter routine has been changed in order to take into account the electron collisional heating and the fact that the total power absorbed per grain is the sum of photon and collisional heating.
In the routine DM_get_collheat, the variable called nbrpho represents the rate of the absorbed photons multiplied by their energy. We created an equivalent variable called nbrcoll which is expressed by:  (A.1)where nH is the gas number density, v(E) the velocity of the impinging electrons, fM(E) the Maxwell-Boltzmann distribution and ζ(E)E the fraction of energy deposited in the grain.
In the routine DM_get_tdist the variable hnumax represents the maximum energy that can be absorbed by a grain. If we consider only the photon absorption, the energy of the hardest photons in a HI region is 13.6 eV. In the case of electron collisional heating, this value can be much larger. We modified the variable numax in order to be the maximum between 13.6 eV and the energy of the most energetic electrons.
In the routine DM_get_tdist, to make the program faster, we distinguish between stochastic heating and thermal equilibrium of dust grains. In Sect. 8 we compared the average time between two events (be they the absorption of photons or collisions with electrons) and the cooling time. When the cooling time starts to be longer than the average time between two events the grain is in a transition between stochastic heating and thermal equilibrium but it is still considered as stochastically heated by the routine DM_get_tdist. Then, when the cooling time is much longer than the average time between two events, it is considered to be in thermal equilibrium. This condition is modelled in the following way: if (Uequi − hνmax) > Umin is satisfied then the grain is in thermal equilibrium. Uequi is defined as the internal energy when the grain is in thermal equilibrium and Umin is the internal energy corresponding to the grain at a temperature equals to the CMB temperature. This is valid since the only source of heating is the photon absorption. After the addition of the collisional heating we changed this condition in this way: (Ueq − E∗) > Umin, with E∗ = n_pho_int ∗ 13.6 eV + n_el_int ∗ max(transf). We define:  (A.2)
(A.2) (A.3)and max(transf) as the maximum transferred energy due to collisional heating.
Finally, the number of points used for the characterization of the temperature distribution has been changed to 400, instead of 200, when we take into account collisional heating. This slows the program a little but allows us to derive the correct temperature distribution for the largest absorbed energies.
All Tables
Size distribution parameters for the Compiègne et al. (2011) dust model (see text for details).
Analytical fit (to within few %) to the electron stopping power in solid carbon (Micelotta et al. 2010).
All Figures
|
Fig. 1 Mass distributions for the four dust types of the Compiègne et al. (2011) model as a function of the grain radius. |
| In the text | |
|
Fig. 2 Transferred energy as a function of the kinetic energy of the impinging electrons for carbonaceous and silicate grains with a radius of 0.1 μm. Carbonaceous grain (black lines): solid line (Micelotta et al. 2010), dotted line (Dwek 1986), dashed line (Dwek 1987). Silicate grain, grey solid line (Dwek 1987). |
| In the text | |
|
Fig. 3 Integrated radiation field J [erg s-1 cm-2 sr-1] as a function of the distance from the galactic plane for R = 1,2,3 hs (dotted, solid and dashed lines respectively) where hs = 5.6 kpc. Red lines show the radiation field obtained with the TRADING model while black lines correspond to the model described in this paper. |
| In the text | |
|
Fig. 4 Spectral energy distribution of the radiation field λJλ for R = 11 kpc and for z = 0,8,22 kpc (from top to bottom). Red lines represent the radiation field obtained with the TRADING model, black lines represent the model described in this paper and the green line represents the galactic radiation field in the solar vicinity obtained by Mathis et al. (1983) rescaled to have the same G0 that we obtain in our model at (R [kpc], z [kpc]) = (11,0). |
| In the text | |
|
Fig. 5 G0 as a function of the distance from the galactic plane for a radial distance R = 0 kpc (dotted line) and R = 22 kpc (solid line) as calculated by our model. |
| In the text | |
|
Fig. 6 Power absorbed per unit area per grain due to photon and collisional heating at z = 0 and R = 14 kpc in NGC 891, where, according to our model, G0 = 1. The collisional heating has been computed as if the plane of the galaxy was consisted of a hot gas with T = 106 and 107 K and for nH = 10-3 cm-3. In the three black lines there is a discontinuity around 1 nm because of the transition between PAHs and a-C:H grains. |
| In the text | |
|
Fig. 7 Power absorbed per unit area per grain due to photon and collisional heating at z = 3.5 kpc and R = 22 kpc in NGC 891, where, according to our model, G0 = 0.1. The collisional heating has been computed for IGM gas with a temperature Tgas = 106 and 107 K and a proton density nH = 10-3 cm-3. In the three black lines there is a discontinuity around 1 nm because of the transition between PAHs and a-C:H grains. |
| In the text | |
|
Fig. 8 Photon absorption time (τabs), electron collision time (τcoll) and cooling times (τcool(coll) and τcool(ph)) for carbonaceous grains with radius from 0.3 to 30 nm. In the case of photon absorption, we assume a radiation field with G0 = 1, while in the case of electron collisions, Tgas = 107 K and nH = 10-3 cm-3 have been assumed. τcool(coll) represents the cooling time in the case of collisional heating only whilst τcool(ph) represents the cooling time in the case of photon absorption only. In all the three lines there is a discontinuity between 0.6 nm and 1.2 nm because of the transition between PAHs and a-C:H grains. |
| In the text | |
|
Fig. 9 dP/dlnT (probability for a grain to be at a certain temperature) in the case of a stochastically-heated PAH molecule (radius a = 0.765 nm) assuming a gas temperature Tgas = 107 K, a gas proton density nH = 10-3 cm-3 and G0 = 1. We notice that the probability distribution in the case of dust heating due to both collisions and photon absorption (black line) is, for most of the temperatures, the sum of the probability distribution due to only photon heating (red line) and the probability distribution due to collisional heating (blue line). |
| In the text | |
|
Fig. 10 Equilibrium temperature, Tequi, with respect to the proton density, nH, for a gas temperature Tgas = 107 K and for a grain of radius a = 0.32 μm, heated only by electron collisions. The black plus signs have been obtained with DustEM and the red line is the straight line fit to these values ( |
| In the text | |
|
Fig. 11 Dust SED for G0 = 1 in the region (R [kpc], z [kpc]) = (14, 0) in the galaxy NGC 891 for an assumed column density NH = 1020 cm-2. The red and blue lines represent the SED due to photon heating only, with (blue line) and without (red line) the size limitation at amin = 2 nm caused by the presence of a gas at Tgas = 107 K and nH = 10-3 cm-3. Black lines represent the various contribution to the SED shown by the red line. |
| In the text | |
|
Fig. 12 Dust SED for G0 = 0.1, in the region (R [kpc], z [kpc]) = (22, 3.5) in the galaxy NGC 891. The red and blue lines represent the SED due to photon heating only, with (blue line) and without (red line) the size limitation at amin = 2 nm. The green line represents the SED due to both photon and collisional heating with the size limitation at amin = 2 nm (we assume the totality of the dust as embedded in the hot gas). Black lines represent the various contribution to the SED shown by the red line. We assume the same column density and gas properties as in Fig. 11. |
| In the text | |
|
Fig. 13 Dust SED due to both photon (G0 = 0.1) and electron collisional heating (nH = 10-3 cm-3, Tgas = 107 K) for different values of amin. |
| In the text | |
|
Fig. 14 Ratio I70/100 computed for the Compiègne et al. (2011) dust model (red lines) and for the Draine & Li (2007) dust model (blue lines). The gas proton density is kept constant at nH = 10-3 cm-3, the solid lines represent the case of the absence of collisional heating and destruction, while the dotted lines and the dashed lines correspond to a gas temperature of Tgas = 107 K and Tgas = 108 K respectively. |
| In the text | |
|
Fig. 15 Same as Fig. 14 but for the ratio I24/70. The two shaded regions represent the variability in the ratio I24/70 due to the uncertainty on amin (see Fig. 13) for our model. |
| In the text | |
|
Fig. 16 Lifetime of carbonaceous grains as a function of the grain size for different gas temperatures. The abrupt drop in the lifetime for the red and green curves is due to ion field emission. The dotted lines represent the lifetime of dust without the inclusion of any charge effect. The dashed horizontal line at 102 yr represents the threshold for observability. |
| In the text | |
Current usage metrics show cumulative count of Article Views (full-text article views including HTML views, PDF and ePub downloads, according to the available data) and Abstracts Views on Vision4Press platform.
Data correspond to usage on the plateform after 2015. The current usage metrics is available 48-96 hours after online publication and is updated daily on week days.
Initial download of the metrics may take a while.