Fig. 16
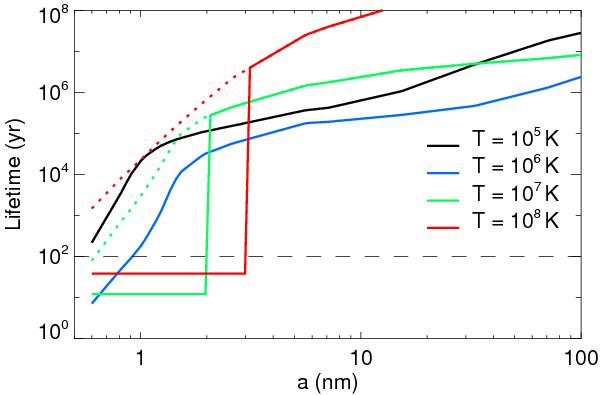
Lifetime of carbonaceous grains as a function of the grain size for different gas temperatures. The abrupt drop in the lifetime for the red and green curves is due to ion field emission. The dotted lines represent the lifetime of dust without the inclusion of any charge effect. The dashed horizontal line at 102 yr represents the threshold for observability.
Current usage metrics show cumulative count of Article Views (full-text article views including HTML views, PDF and ePub downloads, according to the available data) and Abstracts Views on Vision4Press platform.
Data correspond to usage on the plateform after 2015. The current usage metrics is available 48-96 hours after online publication and is updated daily on week days.
Initial download of the metrics may take a while.