| Issue |
A&A
Volume 556, August 2013
|
|
|---|---|---|
| Article Number | A75 | |
| Number of page(s) | 12 | |
| Section | Planets and planetary systems | |
| DOI | https://doi.org/10.1051/0004-6361/201220902 | |
| Published online | 31 July 2013 | |
High angular resolution imaging and infrared spectroscopy of CoRoT candidates⋆,⋆⋆
1 Thüringer Landessternwarte Tautenburg, 07778 Tautenburg, Germany
e-mail: This email address is being protected from spambots. You need JavaScript enabled to view it.
2 Observatoire de l’Université de Genève, 51 chemin des Maillettes, 1290 Sauverny, Switzerland
3 Research and Scientific Support Department, ESTEC/ESA, PO Box 299, 2200 AG Noordwijk, The Netherlands
4 Instituto de Astrofísica de Canarias, 38205 La Laguna, Tenerife, Spain
5 Dpto. de Astrofísica, Universidad de La Laguna, 38206 La Laguna, Tenerife, Spain
6 Laboratoire d’Astrophysique de Marseille, 38 rue Frédéric Joliot-Curie, 13388 Marseille Cedex 13, France
7 McDonald Observatory, The University of Texas at Austin, Austin, TX 78712, USA
8 University of Liège, Allée du 6 août 17, S. Tilman, Liège 1, Belgium
9 Georg-August-Universität, Institut für Astrophysik, Friedrich-Hund-Platz 1, 37077 Göttingen, Germany
10 Observatoire de la Côte d’Azur, Laboratoire Cassiopée, BP 4229, 06304 Nice Cedex 4, France
11 Institut d’Astrophysique Spatiale, Université Paris-Sud 11, 91405 Orsay, France
12 LESIA, UMR 8109 CNRS, Observatoire de Paris, UVSQ, Université Paris-Diderot, 5 place J. Janssen, 92195 Meudon, France
13 LUTH, Observatoire de Paris, CNRS, Université Paris Diderot, 5 place Jules Janssen, 92195 Meudon, France
14 Leiden Observatory, Leiden University, PO Box 9513, 2300 RA Leiden, The Netherlands
15 Department of Physics and Astronomy, Ny Munkegade 120 University of Aarhus, 8000 Aarhus C, Denmark
Received: 13 December 2012
Accepted: 20 June 2013
Abstract
Context. Studies of transiting extrasolar planets are of key importance for understanding the nature of planets outside our solar system because their masses, diameters, and bulk densities can be measured. An important part of transit-search programmes is the removal of false-positives. In the case of the CoRoT space mission, the majority of the false-positives are removed by a detailed analysis of the light curves and by seeing-limited imaging in- and out-of-transit. However, the critical question is how many of the candidates that passed all these tests are false-positives. Such false-positives can be caused by eclipsing binaries, which are either related or unrelated to the targets.
Aims. For our study we selected 25 CoRoT candidates that have already been screened against false-positives using detailed analysis of the light curves and seeing-limited imaging, which has transits that are between 0.7 and 0.05% deep. Our aim is to search for companion candidates that had not been recognized in previous observations.
Methods. We observed 20 candidates with the adaptive optics imager NaCo and 18 with the high-resolution infrared spectrograph CRIRES.
Results. We found previously unknown stars within 2′′ of the targets in seven of the candidates. All of these are too faint and too close to the targets to have been previously detected with seeing-limited telescopes in the optical. Our study thus leads to the surprising results that if we remove all candidates excluded by the sophisticated analysis of the light-curve, as well as carrying out deep imaging with seeing-limited telescopes, still 28−35% of the remaining candidates are found to possess companions that are bright enough to be false-positives.
Conclusions. Given that the companion candidates cluster around the targets and that the J − K colours are consistent with physical companions, we conclude that the companion candidates are more likely to be physical companions rather than unrelated field stars.
Key words: planetary systems / binaries: visual / binaries: eclipsing / binaries: general
Based on observations obtained at the European Southern Observatory at Paranal, Chile in programmes 282.C-5015A, 282.C-5015B, 282.C-5015C, 285.C-5045A, and 285.C-5045B, 086.C-0235A, 086.C-0235B, 088.C-0707A, 088.C-0707B, 090.C-0251A, 090.C-0251B, and 091.C-203(A).
Appendices A and B are available in electronic form at http://www.aanda.org
© ESO, 2013
1. Introduction
Studies of transiting extrasolar planets are of key importance for understanding the nature of planets outside our solar system, because they allow the derivation of their masses, diameters, and hence their bulk densities. While ground-based transit search programmes have made interesting discoveries, the photometric accuracy limits them to special cases. Space telescopes like CoRoT (COnvection ROtation and planetary Transits) open up an entirely new field of research as they permit the detection of very small planets like CoRoT-7b (Léger et al. 2009). While the detection of small-sized planets is interesting by itself, what is really required is the determination of the radius and mass of the planets. The mass-density diagram is the most important diagnostic to find out whether they are low-density gaseous planets like Jupiter, “ocean planets” (Léger et al. 2004), or high-density rocky planets like the Earth. The determination of the mass of a low-mass planet is, however, very time-consuming. Such a huge investment in observing-time can only be justified if it is very likely that a transit is caused by an orbiting planet and not by something else. Removing false-positives (FPs), i.e. physical configurations mimicking a transit-like signal, is an essential part of transit search programmes. As pointed out by Alonso et al. (2004), there are a number of tests for removing FPs. Almenara et al. (2009) showed that 83% of the initial detections in the CoRoT fields IRa01, LRc01, and LRa01 are FPs that can already be removed with a detailed analysis of the CoRoT light curves (see also Brown et al. 2003). The remaining 17% of the candidates require additional observations.
The objects.
CoRoT uses photometric masks generated by the on-board software for measuring the brightness of the target stars. The exact size and form of the masks depend on the brightness and the colour of the star as well on as other constraints (Llebaria & Guterman 2006). Given the size of the mask, which is typically of the order of 35″ × 23″, it is not that unusual that there are stars other than the target within it. If these are eclipsing binaries and sufficiently bright, they could also be FPs. By taking an image during transit and one out of transit, we can find out if such a star is an eclipsing binary or not. Since these images are taken with seeing-limited telescopes, they allow us to detect all potential FPs with distances larger than about 2′′ from the target. This means that seeing-limited imaging allows ≥98% of the FPs caused by field stars to be removed. In principle, the removal of FPs by the detailed analysis of the light curves and the seeing-limited imaging should thus remove almost all FPs. This has been the subject of photometric follow programme of CoRoT, which is described in more detail in Deeg et al. (2009).
The critical question thus is how many of the candidates that passed all these tests are still going to be FPs. Such FPs can be caused by eclipsing binaries located within 2′′ of the targets. These could be either related or unrelated to the targets. Answering this question is interesting not only in the context of the CoRoT survey but also in the context of other similar surveys. Another important aspect is that additional stars within the point spread function (PSF) of CoRoT will change the depth of the transit. It is thus important to know the contamination factor. To answer these questions, we need to explore the area <2′′ from the target star. We thus obtained AO-imaging and high-resolution spectroscopy in the of 25 CoRoT candidates that passed the screening using both the analysis of the CoRoT light curves and imaging in- and out- of transit with seeing-limited telescopes. The candidates and the details of the screening against FPs are described in Carpano et al. (2009; IRa01), in Carone et al. (2012; LRa01), in Cabrera et al. (2009; LRc01), in Erikson (2012; SRc01), and in Cavarroc (2012; SRa03 and LRa03).
Although the seeing-limited imaging is not the subject of this article, we will briefly describe the results obtained for the targets that we discuss.
Summary of the results obtained with NaCo.
2. Observations
2.1. AO-imaging with NaCo
Using the adaptive optics (AO)-facility instrument NaCo (Nasmyth Adaptive Optics System, NAOS and Near-Infrared Imager and Spectrograph, CONICA) mounted on UT4 (Yepun), we obtained diffraction-limited images of 20 CoRoT targets in the J-band. Table 1 gives an overview of the targets that we observed.
As shown in Almenara et al. (2009), diluted binaries are the main source of FPs, particular for candidates with a transit depth ≤0.5%. Diluted binaries consist of a primary star (A) and an eclipsing binary (B and C), which is usually much fainter. The three stars can form either a triple system or an eclipsing binary that is in the fore- or background of the primary.
In the limiting cases, star C is too faint to be detected yet large enough to occult B completely. This is the minimum brightness that an FP can have (e.g. minimum brightness of star B). The depth of the transits detected and the minimum brightness of potential FPs in V and R for the 20 targets observed with NaCo are given in Table 2. The brightness of the FPs in V and R are calculated from the depth of the transit and the brightness of the star. In the case of JFP, we calculate the brightness of potential FPs for the case that the FP is a physical companion and for the case that it is an unrelated background object.
We decided to observe the stars in the J-band with NaCo to minimize the difference between the wavelength at which CoRoT observes and the wavelength of the NaCo observations. However, to plan the NaCo observations, we have to know how deep the images have to be so that all potential FPs can be detected. This means that we have to know the typical colour index of the stars in the field. The UCAC-2 catalog lists the brightness of the stars in the 579 nm to 642 nm-band (label VUCAC) and in the J-band (taken from 2MASS; Skrutskie et al. 2006). Although CoRoT observes the whole wavelength region from 370 to 950 nm, the instrument is most sensitive in the wavelength range between 600 and 700 nm (Costes & Perruchot 2006; Levacher 2006). The wavelength range of the UCAC-2 catalogue thus is close to the wavelength range of the peak sensitivity of CoRoT. Using this catalogue, we derived the VUCAC − J-colours of all stars within 20 arcmin from our targets. As expected, faint stars in the CoRoT fields have red colours. For the targets in LRa01, LRa02, LRa03, and LRa04 we find VUCAC − J = 1.6 ± 1.0, and for SRa01, SRa02, and SR03, VUCAC − J = 1.9 ± 1.2, 1.7 ± 1.0, and 2.0 ± 0.9, respectively. For stars in LRc02 we derive VUCAC − J = 2.9 ± 1.4. Using these numbers, we estimate the minimum brightness of potential FPs in Col. 5 in Table 2. We thus conclude that we have to reach typically J = 20 in order to be certain to detect all potential FPs.
Using total on-source exposure times between 12.5 and 29.2 min, our NaCo images reach a 3-σ detection limits between J = 21.7 and J = 22.4. This is deep enough to detect FPs. Because we exposed the individual images short enough so that the target stars are not saturated, we can use them as photometric reference stars. In many cases, the NaCo images also contain other stars that are listed in the 2MASS (Skrutskie et al. 2006). We can thus determine the photometric error by determining their brightness in NaCo images and comparing these with the values given in 2MASS.
In three cases where we found companion candidates (CCs), we obtained J- and K-band images in order to constrain their nature. The detection limits are almost the same in both filters, although these stars are brighter in the K-band and the Strehl ratio is also higher.
Six objects were observed in visitor mode in December 2010 and 12 objects in December 2011, the others were observed in service mode. Although articles about CoRoT-7b and CoRoT-32b have or are being published, we mention them in this article because they are part of the same observing programme (Léger 2009; Gandolfi et al. 2012). Except for CoRoT-7b, which was observed with the S13 camera, all observations were taken with the S27-camera which has an image scale of  per pixel, and a field of view of ~27″. To detect faint background stars within the PSF of the primary stars, we used the high-dynamic range mode of NaCo and adjusted the individual exposure time so that they were not saturated. We thus used individual exposures (DITs) between 2 and 60 s, depending on the brightness of the object. To remove instrumental artifacts we rotated NaCo typically nine times in position angle with steps of 10°.
IRAF (Image Reduction and Analysis Facility) routines were used to flat-field the data, remove cosmic rays hits, remove detector artifacts, and derotate the individual images so that north is up and east is left in all images. The final images were then created by co-adding the individual images using a kappa-sigma clipping algorithm after shifting them to the same position and derotating them. By combining images taken at different rotation angles of the instrument, artifacts are very efficiently removed because they rotate with the instrument. To search for faint stars within the PSF of the targets, we constructed a rotationally averaged PSF for each target, which we then subtracted from it. This self-referencing avoids artifacts that are usually introduced if a PSF of a standard star is subtracted because standard stars never have exactly the same brightness and colour as the target. The self-referencing using a rotationally averaged PSF works so well because the images also are created from frames that are rotated before they are averaged.
In cases where we found stars within the PSF of the primary, we measured the stellar brightness of the secondary after first subtracting the PSF of the primary. We did this subtraction in several different ways to determine the photometric error introduced by the process.
2.2. Near-infrared spectroscopy with CRIRES
Although NaCo allows stars as close as 0 3 from the target to be detected, it is still possible that there are stars within that distance from the primary. The type of FP that is the most difficult to exclude is a K- and/or M-type companion (Guenther & Tal-Or 2010). The best way to detect such a companion is to obtain high-resolution near-infrared (NIR) spectra. If a candidate had a companion, we would detect lines that are specfic for a K- and/or M-type companion star, like strong CO lines. We thus obtained high-resolution infrared spectra of 18 candidates with CRIRES (CRyogenic high-resolution InfraRed Echelle Spectrograph) mounted on UT1 (Antu).
Because we are limited to stars bright enough to be used as natural guide stars, we could not observe all candidates with CRIRES. As also explained in Guenther & Tal-Or (2010), the best wavelength region is the K-band because the difference in brightness between a G- and an M-star is much smaller in the K-band than at shorter wavelengths. Using longer wavelengths is not useful, because the sky brightness increases dramatically when going to the L or M-band.
We used two settings that are both well suited for detecting late-type companions. The first of these covered the wavelength range 2241.5 to 2281.4 nm (vacuum), which contains a number of prominent CaI lines that are strong in K- and M-stars (Wallace & Livingston 1992). We used a slit width 03, which gives us a resolution of λ/Δλ ~ 60 000. The second setting covered the wavelength region from 2284.1 to 2322.9 nm (in vacuum), which contains a dense forest of CO-overtone lines. These lines are almost absent in F-stars but increase in strength from spectral type G to mid-M. Using a newly installed fixed slit with a width of 04 gave a resolution of λ/Δλ ~ 48 000. An overview of the objects observed with CRIRES is given in Table 3.
Summary of the results obtained with CRIRES.
The initial steps of the data reduction (removing artifacts, flat-fielding, correcting for the non-linearity of the detector) were done using the ESO pipeline and also independently with IRAF, yielding similar results. Since the spectra were taken by nodding the star along the slit, we removed the sky background and the bias offset by subtracting two spectra taken at different positions along the slit. Each spectrum was then individually extracted and wavelength calibrated using the telluric lines. The final spectra of the stars were then created by averaging all individual spectra of that star taken during the same observing night. The telluric lines were removed by using spectra taken of hot stars at the same airmass also from the same night. An example of a reduced spectrum is shown in Fig. 2.
3. Stars with companion candidates
In this section we discuss the objects where we found faint stars within 2′′ of our targets. In the following we use the CoRoT Win-IDs for the targets because they are easier to remember. For completeness, we list the Win-IDs, the 2MASS numbers, and the position of all targets observed in Table 1.
Properties of the companion candidates.
The results of the NaCo and CRIRES observations are summarized in Tables 2 and 3. The objects where we found CCs are LRa01_E1_2101, LRa01_E1_4719, LRa03_E2_0861, LRa02_E1_1715, LRa02_E2_1136, LRa04_E2_0626, and LRc07_E2_0158. Figure 1 shows images of the objects with CCs. The dark line in this figure corresponds to one arcsec. Because we observed the CCs in the infrared, we do not know how bright they are in the optical. However, if they are unrelated to the targets, we can give an estimate based on the typical colour index of field stars in the vicinity of the targets. If CCs are physical companions, we can calculate their brightness from the flux in the infrared and the spectral type and brightness of the primary in the optical and in the infrared. The NaCo results are summarized in Table 2,
In total, 11 of the 20 stars observed with NaCo have a transit depth ≤0.1%, and 9 have deeper ones. We found CCs in three of the objects with deep transits (33 ± 20%) and in five of targets with shallow transits (45 ± 20%). Although this is still a small number statistics, the result is not surpring because fainter stars could potentially be source of FPs for a shallower transit.
The estimated brightness of the CCs in the optical is given in Table 4. The objects with CCs are discussed individually in Appendix A. As an example for the CRIRES spectra that we have taken, we show in Fig. 2 a section of the spectrum containing the CO lines of LRa01_E1_2101. As an example of how we exclude companion stars using the cross-correlation technique, we show in Fig. 3 a simulated cross-correlation function of LRa01_E1_2101 with a hypothetical M3V star added.
We obtained J- and K-band images for LRa_E1_4719, LRa_E1_1715, and LRa02_E2_1136. Figures 4−6 show the colour-magnitude diagram of the stars. The absolute brightnesses of the CCs are calculated assuming that they are at the same distance as the targets. The J − K colours are derived from the observations. For comparison, we also show the brightness and J − K colour of standard stars (small dots) as given in Lépine et al. (2009), Henry et al. (2006), and Bilir et al. (2009). In all cases the J − K colours are consistent with physical companions. Whether it is more likely that the CCs are physical companions or unrelated backgrounds stars will be discussed in Sect. 5.
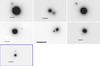 |
Fig. 1 NaCo images of objects with CCs were found. Top row from left to right: LRa01_E1_2101, LRa01_E1_4719, LRa03_E2_0861. Middle row from left to right: LRa02_E1_1715, LRa02_E2_1136, LRa04_E2_0626. Bottom row: LRc07_E2_0158. North is up and east is left in all images. The dark line corresponds to one arcsec. Details about the object are given in Table 2. |
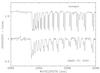 |
Fig. 2 Part of the CRIRES spectrum of LRa01_E1_2101 and a spectrum of a sunspot for comparison. The CO lines are seen in both spectra. |
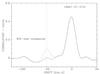 |
Fig. 3 Cross-correlation function of LRa01_E1_2101 (full line) together with a simulated cross-correlation function of LRa01_E1_2101 with a hypothetical M3V star added (dashed line). An M3V companion can thus be excluded. |
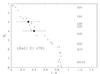 |
Fig. 4 Colour−magnitude diagram of the two stars of LRa_E1_4719 (big dots). For comparison, we also show the brightness and J − K colour of standard stars (small dots) as given in Lépine et al. (2009), Henry et al. (2006), and Bilir et al. (2009). |
4. Stars without candidate companions
The 18 objects were we did not find any CCs within 2′′ of our targets are discussed in Appendix B. Eight of these were observed with NaCo and CRIRES. These are: LRa01_E1_0286, LRa01_E2_0165 (CoRoT-7), LRa02_E1_4601, LRa02_E2_2057, LRa03_E2_0678, LRa06_E2_5287, SRa01_E1_0770 and SRa02_E1_1011. Five objects were only observed with NaCo. These are: LRa01_E1_2240, LRa02_E2_3804, LRa03_E2_1326, LRc02_E1_0591, and SRa03_E2_2355. For these objects the NaCo images alone do not allow to fully exclude faint companion star with a separtion of less than  . Another five were only observed with CRIRES. These are: LRa01_E1_4667, LRa02_E1_1475, LRa07_E2_3354, SRa03_E2_1073, SRa04_E2_0106 (CoRoT-32). Given that CRIRES is an AO-instument, we used the aquisition images taken in the K-band in order to exclude companions with separtions larger than about . However, as discussed in Appendix B these images are not as deep as the NaCo-images.
5. Discussion and conclusions
5.1. Would it be possible to detect the companion candidates with seeing-limited telescopes?
We have sudied 25 CoRoT candidates. Of these, 13 were observed with NaCo and CRIRES. CCs were found in seven of them. All of them were found in the NaCo images. Another seven objects were only observed with NaCo, and another five only with CRIRES. In two of the targets observed with CRIRES, we detected very weak CO lines. However, since both are G0V stars, it is possible that these are the weak CO lines from the star itself. Depending on whether we should count only the objects that have been observed with NaCo or all objects, we find that the rate of targets with CCs is 28 or 35%, respectively.
The discovery of so many CCs raises the question if it would have been possible to detect them with seeing-limited telescopes. The properties of the CCs found are given in Table 4. The candidates found either have a separation ≤1″ or are 4 to 9 mag fainter in the optical regime and have a separation ≤2″. Detecting such objects with a seeing-limited telescope is not possible. It is thus not surprising that we did not detect these stars before.
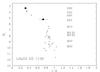 |
Fig. 6 Colour−magnitude diagram of the two stars of LRa02_E2_1136. |
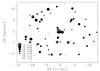 |
Fig. 7 Positions and brightnesses of all stars detected by NaCo other than the targets in the anti-centre fields. There is a notable excess of stars within 2′′ of the targets. |
5.2. What is the nature of the companion candidates?
Figure 7 shows the position and brightness of all stars, other than the targets that we detected in the anti-centre fields. The sizes of the symbols indicate the brightness of the stars in the J-band. The stars clearly cluster at the centre arround the targets. The probabilty that this distribution of stars in the field is just a chance coincidence is only ~4 × 10⁻⁶. This means that it is very unlikely that so many stars are found within two arcsec of the targets hust by chance. Since background stars are expected to be homogenesously distributed over the field of view, the distribution of stars favours the hypothesis that they are physical companions.
Figure 8 shows the distribution of binaries in the solar neighbourhood from Duquennoy & Mayor (1991). The dashed lines are the projected distances of the CCs if we assume that they are physical companions. Since the projected distances are close to the maximum of the distribution of binaries, it is quite plausible that they are physical binaries.
As discussed in Sect. 3, we can calculate the J − K colours for the assumption that the CCs are physical companions (J − Kphys), and for the assumption that they are unrelated background stars (J − Kback). J − Kphys, is derived by using the brightness difference between the target and the CC to calculate the spectral type of a physical companion, from which we obtain its J − K colour, and J − Kback from the average colour of stars within 10′ of the target taken from 2MASS (Skrutskie et al. 2006). Since we obtained J- and K-images for three of the CCs, we can compare the observed colour J − Kobs with J − Kphys and J − Kback.
For the LRa01_E1_4719 CC, we derive J − Kobs = 0.4 ± 0.3, J − Kphys = 0.50 ± 0.07 (G9V), and J − Kback = 0.64 ± 0.36 (Fig. 4). The colour of the companion candidate thus is consistent with a physical companion, but this does not prove that it is a companion because field stars have the same colour. For LRa02_E1_1715 CC we find J − Kobs = 1.1 ± 0.2, J − Kphys = 0.9 ± 0.1 (M4V), and J − Kback = 0.73 ± 0.37 (Fig. 5). The situation is the same as with LRa01_E1_4719 CC: the colour of the companion candidate is consistent with a physical companion but also consistent with a background star. The third object is the companion candidate of LRa02_E2_1136 (Fig. 6) for which we obtain J − Kobs = 0.9 ± 0.2, J − Kphys = 0.70 ± 0.05 (K4V-K5V), and J − Kback = 0.73 ± 0.37.
Thus in all three cases, the colour of the companions is consistent with physical companions as well as with an unrelated background star. Table 4 thus gives the brightness in the optical regime for both hypotheses. The distribution of stars within the field of view makes it, however, more likely that they are physical companions. This raises the question of whether the expected number of CCs corresponds to the expected number of binaries with that separation. As shown in Fig. 8, we expect to find only 6−7% of the stars to be binaries with this separation but we found of 28−35% of the candiates have CCs.
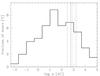 |
Fig. 8 Distribution of binaries in the solar neighbourhood taken from Duquennoy & Mayor (1991). The dashed lines indicate the projected distances of the companion candidates, assuming that they are physical companions. |
One question that we cannot answer yet is whether the CCs are eclipsing binaries by themselves and thus FPs. Since 8% of the stars in the solar neighbourhood are triple stars (Tokovinin 2008) and since triple stars containing two eclipsing late-type binaries are not that rare (e.g. Guenther et al. 2001), it is possible that many CCs are FPs. An alternative explanation is that planets form preferentially in binary systems. More observations are thus needed to find out whether they are physical companions or not and whether they are eclipsing binaries or not.
5.3. The rate of candidates, false-positives and planets
As mentioned in the introduction, most of the FPs are removed by the detailed analysis of the light curves, by taking one image during transit and one out of transit with a seeing-limited telescope, and by spectroscopic observations.
Although the seeing-limited observations are not the subject of this article, it is interesting to know what the total fraction of candidates is that were identified as FPs and what the fraction of stars with planets is amongst the candidates. In other words, how many of the original candidates are FPs and how many stars have planets? In IRa01 9872 stars were analysed, and 50 sources were classified as planetary transit candidates, of which two are planet host stars (Carpano et al 2009). In LRa01 11408 stars were analysed, 51 sources were classified as planetary transit candidates, and four stars hosting planets were found (Carone et al. 2012). In LRc01 11408 stars were analysed, 42 sources were classified as planetary transit candidates, and three planets and one brown dwarf were found (Cabrera 2009). In SRc01, 6974 light curves were analysed, and 51 candidates were found, but no planet has been found yet (Erikson 2012). In the case of LRa03, 5329 light curves were analysed, and 19 candidates were found but no planet has been found yet. For SRa03, 4169 light curves were analysed, 11 candidates were identified, and three planets were found (Cavarroc 2012). To sum it up, 49 160 stars were observed, 224 candidates were identified, and so far 12 planet host stars and brown dwarfs have been found in IRa01, LRa01, LRa03, LRc01, SRc01, SRa03. The frequency of planets amongst the candidates in these fields thus is ≥5%.
In this work we studied objects in the field LRa01, LRa02, LRa03, LRa04, LRa06, LRa07, SRa01, SRa02, SRa03, SRa04, LRc02, and LRc07. In total CoRoT observed 88478 stars in these fields, 306 candidates were identified, and 18 planets have been found so far. Thus, 6% of the candidates are planet host stars, which is quite similar to the results obtained for the fields for which detailed reports have been published. However, if we just take the top priority candidates, since we included only these ones in the follow-up observations with NaCO and CRIRES, and if we take only the fields LRa01 to LRa03 and SRa01 to SRa03, where the follow-up observations are almost completed, we find a somewhat different picture. In this case at least 21% of the candidates are planet host stars. We identiffied 15% of the candidates as FPs using on/off photometry with seeing-limited telescopes, 13% of the candidates because the spectral classification showed that the stars are either giants, or early-type stars or rotate too rapidly to allow precision radial-velocity measurements. We excluded another 17% using radial-velocity measurements, which showed that these objects are binaries. The NaCo/CRIRES observation removed another 9% of the candidates from the list. The remaining 25% of the stars are simply too faint to carry out radial-velocity measurements, or the RV-amplitudes were too small to yield a detection.
6. Conclusions
Using adaptive optics imaging and high spectral resolution NIR spectroscopy, we have investigated a sample of 25 CoRoT targets for contamination of previous seeing-limited PSFs by FPs, i.e. very close eclipsing binaries that would mimic the signature of a transiting planet in the light curves obtained by CoRoT. Two of the targets are in LRc fields where we a priori expected a high rate of background sources. Only 13 of the 23 objects in the LRa field were observed with NaCo and CRIRES. Of these six have CCs. Since for the other ten objects we obtained either only CRIRES or only NaCo-data, and since the CRIRES spectra often are not deep enough to exclude all types of CCs, the true number of targets with CCs could even be higher. This relatively high rate of targets with CCs is, however, roughly the same for Kepler.
Online material
Appendix A: Detailed description of the stars with companion candidates
Appendix A.1: LRa01_E1_2101
Seeing-limited images obtained with the 3.6 m Canada France Hawaii Telescope (CFHT; located at Mauna Kea, Hawaii, USA), the IAC 80 cm (located at Izaña Tenerife, Spain), and the 1.2 m robotic MONET telescope (located at McDonald Observatory, USA) did not show any stars in the field that became significantly fainter during transit. The NaCo image shows a previously unrecognized star with J = 16.3 ± 0.1 at a distance of  (
( E and
E and  N) from the primary (Fig. 1). If it were an unrelated star to the target and using the average colour of stars in the field, we estimate that it would be about VUCAC ~ 17.9. If it were a physical companion, its brightness would correspond to that of an M5V-star, which would be V ~ 21.5 and R ~ 19.7. Thus, no matter if the CC were related or unrelated to the primary, it is in both cases bright enough to be an FP. If the CC were a physical companion, it would be at a distance of ~300 AU from the primary.
We obtained a spectrum with CRIRES of LRa01_E1_2101 in the range of the CO bands (2284.1 to 2322.9 nm). To search for additional companions, we kept the CC outside of the slit. Figure 2 shows part of the CRIRES spectrum together with a spectrum of a sunspot (Wallace & Livingston 1992). The spectrum of LRa01_E1_2101 shows only the CO lines of the primary but not of any other additional star. Using the cross-correlation function, we derived an upper limit for possible additional companions. Figure 3 shows the cross-correlation function of LRa01_E1_2101, together with that of a hypothetical M3V companion star. We can thus exclude that there is any additional CC with a spectral type of M3V or earlier with a separation of 03 or less.
Appendix A.2: LRa01_E1_4719
Seeing-limited images obtained with the MONET telescope did not show any contaminants. According to EXODAT, the spectral type of the object is F8IV. However, in the NaCo images, the target is nicely resolved into two stars with a separation of 08. This is shown in Fig. 1 where the fainter component can be found 071 W and 044 S of the brighter one. To assess the nature of the companion, we obtained J- and K-band images. From the images, we derive J = 14.8 ± 0.1 and K = 14.5 ± 0.2 for the primary and J = 15.8 ± 0.1, K = 15.4 ± 0.2 for the secondary.
Figure 4 shows the absolute brightness in the J-band (MJ), and the J − K colours, assuming that the two objects are at the same distance, together with the absolute brightness and colours of stars taken from Lépine et al. (2009), Henry et al. (2006), and Bilir et al. (2009).The brightness as well as the J − K-colours of the secondary is in agreement with being a physical G9V-companion at a projected distance of ~1900 AU. If the CC were either bluer or redder, we would know that it is an unrelated star. Table 4 gives the brightness of the companion in the optical regime for the case that it is a physical companion, as well as for the case that it is an unrelated background star. In both cases the CC is bright enough to be an FP.
The transit could thus either be on the primary, or on the secondary. If it is on the primary, the size of the occulting object would be ~0.4 RJup, and if it is on the secondary, the size would be ~0.7 RJup. Thus, in both cases the transiting object could be a planet.
Appendix A.3: LRa02_E1_1715
The spectral type of this object is G2IV/V, as determined from a HIRES spectrum taken with the Keck telescope. Seeing-limited images with CFHT, the 1.2 m Leonard Euler telescope at ESO, La Silla, and the IAC 80 cm telescope gave us the result that the transit is on target. However, NaCo resolves the target into two components, which have a separation of 152 (companion 140 W, 060 N of the primary and J = 18.8 ± 0.1, K = 17.7 ± 0.1; see Fig. 1). In order to constrain the nature of the companion, we took J- and a K-band one. Figure 5 shows the absolute brightness in the J-band (MJ), assuming that the two objects are at the same distance, together with the J − K colours of the two stars. Both stars are slightly redder than the standard stars. Since they are reddened by the same amount, the data are fully consistent, with the hypothesis that their two stars are at the same distance. Thus, the colour and the brightness difference between the primary and secondary is consistent with an M4V star companion at a projected distance of about 1400 AU. If the transit were on the primary, the occulting object would have ~0.2 RJup and where thus be in the planetary regime. In the case the transit is on the secondary, the occulting object would have a radius between ~1.5 and ~3 RJup, corresponding to a low-mass star.
Appendix A.4: LRa02_E2_1136
Images taken with the 1m ESA OGS telescope (Izaña Tenerife, Spain) allow exclusion of FPs with V < 21 at distances larger than three arcsec from the target. We obtained NaCo images in the J- and in the K-band of this object. In both images the object is resolved into two stars with a separation of 04 (primary: J = 12.6 ± 0.1, K = 12.2 ± 0.1, secondary: 034 ± 003 E, 016 ± 003 S, J = 14.5 ± 0.1, K = 13.6 ± 0.1; Fig. 1). The primary is a G0V star. Since not only the brightness difference but also the J − K colour matches that of a K4V to K5V companion, it is likely that this star is a physical companion at a projected distance of ~800 AU (Fig. 6). Because the transit is only 0.3% deep, it could be either on the primary or the secondary. If it is on the primary, the transiting object would be ~0.6 RJup, and if it is on the the secondary, it would be due to a ~2.4 RJup object. Thus it could either be a planet or a low-mass star. Interestingly, the NaCo images show another binary (Corot-ID 110676867, 2MASS06515971-0536425) in the same field of view, but the distance to LRa02_E2_1136 is quite large, 1144 (956 E and 656 N). The distance between the two stars is 027, and the two components are J = 15.5 ± 0.2 and J = 15.6 ± 0.2.
Appendix A.5: LRa03_E2_0861
When making the acquisition image of LRa03_E2_0861 with CRIRES, we recognized a CC. The CC is at a distance of 108 from the primary (companion 078 E, 075 N of the primary; Fig. 1). A subsequent image taken with NaCo showed that the CC is J = 16.4 ± 0.1. The star is thus bright enough to be a FP (Table 4). If this star were a physical companion, it would be an M4V star at a 600 AU. Seeing-limited images taken during transit with the Euler telescope and the CFHT telescope show the transit, but the faint star detected with NaCo and CRIRES can not be fully excluded as an FP. The situation is the same as for LRa02_E2_1136: If the transit is on the primary, the object has the size of a planet. If it is on the companion, it has the size of a star.
Appendix A.6: LRa04_E2_0626
The NaCo image of this star shows a previously unrecognized star, which is J = 16.8 ± 0.1, at a distance of 09 from the primary (08 E, 04 S; Fig. 1). If it were a physical companion, it would be an M3V star at a 600 AU. Images taken during transit with the 0.6 m TRAPPIST telescope at ESO, La Silla (Gillon et al. 2011), show part of the transit, but the faint star detected with NaCo is not resolved and thus cannot be fully excluded as an FP. The CRIRES spectrum does not show any additional CC. Also for this object we have the same sitation as above: The transiting object can have either the size of a planet or a star. That depends on whether the transit is on the primary or the secondary.
Appendix A.7: LRc07_E2_0158
The NaCo image of this star shows a previously unrecognized star, which is J = 14.6 ± 0.1, at a distance of 09 from the primary (00 E, 09 N; Fig. 1). A deep image taken with the EULER telescope, in fact, shows no sign of this star. NaCo was thus required to detect it. A spectrum taken with the TLS-NASMYTH spectrograph mounted on the 2 m Alfred-Jensch telescope at Tautenburg (Germany) shows that this star has a spectral type F9IV or F9V. If it were a physical companion, it would be an M1.5V star at 400 AU. As shown in Table 4, the star is bright enough to be an FP.
Appendix B: Detailed description of the stars without companion candidates
Appendix B.1: LRa01_E1_0286
We observed LRa01_E1_0286 with NaCo and found six faint stars: The closest star has a brightness of J = 15.7 ± 0.1 and a distance of 50 (10 E, 49 S). This star has already been detected in the optical. The next closest is at a distance of 86 (80 W, 30 S) and is only J = 17.4. No additional star closer to the target was found.
We also obtained a CRIRES spectrum of this star. The spectrum shows the CO lines with a strength corresponding to an M0V star that is about 2−3 mag fainter. However, a TLS-NASMYTH spectrum shows that the star has a spectral-type G0V star. Since the strength of the CO lines is what is expected for an early G star, the CO lines are thus presumably the lines of the primary.
Appendix B.2: LRa01_E1_2240
LRa01_E1_2240 was observed with NaCo but not with CRIRES. We found three nearby stars that are at 56 (36 W, 43 N), 64 (39 W, 51 N), and 72 (46 W, 55 N) distance. The stars have a brightness of J = 17.8 ± 0.1, J = 16.4 ± 0.1, and J = 17.9 ± 0.1, respectively.
Appendix B.3: LRa01_E1_4667
We obtained a spectrum with CRIRES of this star. This spectrum allows exclusion of a companion star with a spectral type M3.5V or earlier. Since CRIRES is also an AO-instrument, we can also use the aquisition image to search for previously unrecognized CCs close to the star. From the aquisition image taken in the K-band we can exclude a companion of roughly the same brightness as the target within two arcsec.
Appendix B.4: LRa01_E2_0165, or CoRoT-7
As part of this programme, we obtained deep images with NaCo and CRIRES of the field surrounding the CoRoT-7 object. The results are discussed in detail in Léger et al. (2009), where we report that we did not find any CCs. We do not discuss this object further here but refer instead to the above-mentioned paper.
Appendix B.5: LRa02_E1_1475
This star is an A4V star with a transit that is 0.3% deep. This means that the eclipsing object could have a size of about 0.1 Rsun, corresponding to the size of Jupiter. From the depth of the transit and the spectral type of the primary, we find that an FP would have to be a star with a spectral type of K7V, or earlier that is being eclipsed. We thus have to exclude stars with spectral type K7V to prove that the transit is on target. The aquisition image shows the star 2MASS06512856-0348468 which has K = 15.8 and thus 3.2 mag fainter than the target in K. The images show three additional stars. The first one is at a distance of 28 south-east of the target, the second 48 (43 W, 23 N), and the third one at a distance of 65 (64 W, 07 S). All four stars had already been observed with the CFHT and in all cases an FP was ruled out. The CRIRES aquistion image alone already allows physical companions with spectral types earlier than K3V to be ruled out. Using the Mg 4383.23 cm-1, and Fe 4396.25 cm-1 line, we can rule out companions with spectral type F6V stars or earlier. The observation thus does not fully rule out all possible FPs but still a large number of them.
Appendix B.6: LRa02_E1_4601
For this object we carried out the most comprehensive study by taking NaCo images in J and K and CRIRES spectra in both settings. We can thus use these data to assess which setting is the most sensitive.
The NaCo J-band image would have allowed us to detect a star of J = 17 at a distance of 018 from the primary, a star of J = 18 at 023 distance, and a star with J = 19 at 058 distance. The limits for the K-band image are 016 for a star of K = 16, 030 for K = 17, and 051 for K = 18. If we assume that we want to detect a physical binary, than the limit in both filters is almost the same, although the J-band image is deeper. In both cases, we can exclude companions with spectral types earlier than M2.5V for distances ≥02 from the primary. For distances ≥025, the limit is an M3.5V star and for distances ≥05 a M4.5V star.
Figure B.1 shows part of the spectrum taken with the first setting which contains prominent Ca I lines. This spectrum allows exclusions of companion stars that are earlier than M1V. We note that the Ca-lines at 2261.4 nm and 2263.1 nm (vacuum) are single in the spectrum of the Sun and LRa01_E1_2101 but double in the spectrum of the sunspot due to the Zeeman effect (the magnetic field strength of the spot is 3360 Gauss). Figure B.2 shows a part of CRIRES spectrum taken with the second setting containing the CO lines. Although this spectral region is close to the edge of the K-band and thus the sensitivity of CRIRES is lower, the number of CO lines is so large that the sensitivity for detecting CCs is an higher. Using this spectral range, we exclude companions earlier the M2.5V. Thus, the second setting is more sensitive for detecting stars with CO lines.
As a third approach we also derived the spectral energy distribution, that shows no excess which would indicate a late-type companion (Fig. B.3). Altough this results conforms to the previous ones, the SED method is significantly less sensitive than the observations with NaCo and CRIRES.
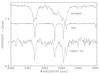 |
Fig. B.1 Part of the CRIRES spectrum of LRa02_E1_4601 taken with the first setting, together with a spectrum of the Sun and a sunspot. |
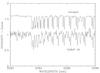 |
Fig. B.2 Part of the CRIRES spectrum of LRa02_E1_4601 taken with the second setting, together with a spectrum of the Sun and a sunspot. |
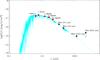 |
Fig. B.3 Spectral energy distribution of LRa02_E1_4601. There is no excess in the IR. This is consistent with the NaCo and CRIRES results that the third object of this system is not a star. |
Appendix B.7: LRa02_E2_2057
The closest star to LRa02_E2_2057 seen in the NaCo image is at a distance of 51 (22 E, 28 N), and it is J = 19.1 ± 0.1. There is another star with J = 21.1 ± 0.1 at a distance of 74 (74 E, 00 N). Since an FP could be as faint as J = 20.9 ± 1.0, both stars are bright enough to be FPs. Observations with the IAC 80 cm telescope and the CFHT show that neither star is an FP. The CRIRES spectrum of LRa02_E2_2057 excludes companions with spectral types M0V or earlier. This means that the CRIRES spectrum allows companions with R ≤ 18.6 ± 0.2 to be excluded. However, an FP could be as faint as R = 22.5 (corresponding to a companion with spectral-type M3V). There is thus still the possibility for an FP but this companion would have to be much closer than one arcsec to the target and it would have to have a spectral type in the range between M1V and M3.5V. A companion with exactly these properties is not very likely.
Appendix B.8: LRa02_E2_3804
The observations of LRa02_E2_3804 with NaCo did not show any CC. The closest star to LRa02_E2_3804 is already at a distance of 100 (52 W, 86 N), and it is J = 18.3 ± 0.1.
Appendix B.9: LRa03_E2_0678
The expected brightness of an FP is J ≤ 18.9 ± 1.0. The closest star found is at a distance of 98 (21 E, 96 N) and has J = 19.4 ± 0.1. Observation with the CFHT and with the IAC 80 cm telescope rules out that this star is an FP. The CRIRES observations exclude companions earlier than M1V, corresponding to a star with R = 13.9. Also in this case, the CRIRES observations are not deep enough to exclude close companions of very-late spectral type, but they exclude at least all companions earlier than M1V.
On-off photometry of stars in the field of LRc02_E1_0591.
Appendix B.10: LRa03_E2_1326
In the case of LRa03_E2_1326, the closest stars found in the NaCo images are already at distances of 83 (64 E, 52 N) and 105 (01 E, 104 S) and have a brightness of J = 16.9 ± 0.1 and J = 17.9 ± 0.1.
Appendix B.11: LRa06_E2_5287
The NaCo image obtained of LRa06_E2_5287 shows ten stars, in addition to the target. The closest one is at a distance of 36 (13 E, 34 S) but it is J = 20.3. The next closest star is at a distance of 50 (37 W, 34 N), but it is even J = 21.4. These stars should thus are too faint to be FPs.
CRIRES spectrum was taken that shows weak CO lines. A subsequent spectrum taken with the TLS-NASMYTH spectrograph shows that the primary is a G0V star. Since such a star has weak CO lines, we interpret the lines as coming from the target itself.
Appendix B.12: LRa07_E2_3354
Like LRa02_E1_1475, LRa07_E2_3354 an early-type star. The aquisition image taken with CRIRES shows no star within 100 arsec of the target. For the CRIRES observation, we used the first setting and the Mg 4383.23 cm-1, and Fe 4396.25 cm-1 to exclude companions. Given that a TLS-NASMYTH spectrum shows that it is a B9 star, we can rule out companions earlier than A6V. Since the transit is 3.9% deep the eclipsing object could still well be a late K or early M star.
Appendix B.13: LRc02_E1_0591
This object is is located in the “galactic center” eye (LRc-fields) of CoRoT. The density of stars in this region is much higher than in the “galactic anti-center” eye (LRa-fields). The large number of stars in this field made it necessary to obtain two images with NaCo. One was taken during transit and the other out of transit. Figure B.4 shows the image taken out of transit. Table B.1 gives the brightness measurements and their differences obtained in the two images. Three stars, labeled PVP1, PVP2, and PVP3 in Fig. B.4, and Table B.1, were a little bit fainter during transit than out of transit. Since potential FPs of LRc02_E1_0591 have to be J ≤ 17.6 ± 1.6 (see Table 2), these stars could potentially be FPs. However, images taken with the IAC 80 cm and the Euler telescope show that all of them are too faint in the optical and thus can not be FPs.
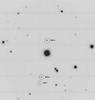 |
Fig. B.4 NaCo image of LRc02_E1_0591 taken in the J-band. Marked as PFP 1, 2, 3 are stars that became fainter during the transit (“potential FP”). See also Table B.1. North is up and east is left. |
Appendix B.14: SRa01_E1_0770
The two closest stars to SRa01_E1_0770 are at a distance of 62 (52 E, 35 S) and 110 (12 E, 109 N) and have J = 18.8 ± 0.1, and J = 17.8 ± 0.1. Since we have to remove FPs with J ≤ 17.5 ± 1.2, the second star is just bright enough that it could be an FP. However, seeing-limited observations are sifficient to find out if this star is an FP or not. The situation with the CRIRES observations is the same as for the other stars. The spectra allow exclusion of companions earlier than M0V, corresponding to stars of R = 17.0, but this is not sufficient to fully exclude all types of FPs.
Appendix B.15: SRa02_E1_1011
Using a spectrum obtained with the TLS-NASMYTH spectrograph, we derived the spectral type of this star, which is F6V. The NaCo image shows two additional stars. They are J = 18.9 ± 0.1 and J = 16.2 ± 0.1 and are at distances of 89 (56 E, 69 N), and 98 (78 E, 58 S), respectively. Both stars are thus well separated from the primary, and observations with seeing-limited telescopes could show if these are FPs or not. The CRIRES observations permit us to exclude companions earlier than M0V corresponding to stars with R ≥ 17.7. As before, the CRIRES observations are not deep enough to exclude companions of very late-type, but they do allow the exclusion of most of them.
Appendix B.16: SRa03_E2_1073
A TLS-NASMYTH spectrum shows that this star has a spectral type F3V. The CRIRES spectrum allows exclusions of a companion that is 1.7 mag fainter in K and has CO lines like an M0V star. However, this does not exclude stars with spectral type K2V because the CO lines in these stars are weaker. Since the CO lines become progressively shallower for earlier type stars, an eclipsing binary with spectral type G cannot be fully excluded.
Appendix B.17: SRa03_E2_2355
The three closest stars detected in the NaCo images of SRa03_E2_2355 are J = 17.0 ± 0.1 (distance of 30; 08 E, 252 S), J = 20.2 ± 0.1 (distance of 42; 40 E, 12 S), and J = 18.1 ± 0.1 (distance of 92; 40 E, 83 S).
Appendix B.18: SRa04_E2_0106, CoRoT-32
This object is CoRoT-32. Since it is discussed in Gandolfi et al. (2012), we will just briefly mention the results here. We obtained a spectrum and an aquisition image with CRIRES. The limiting magnitude of the aquistion image is K ≥ 13.9. No additional stars were detected within 124 of the target, which means that physical companions with a spectral type M2V or earlier can be excluded. The CRIRES spectrum itself allows exclusion of physical companions with a spectral type M3V or later.
Acknowledgments
We are grateful to the user support group of VLT for all their help and assistance in preparing and carrying out the observations. Some of the data presented were acquired with the IAC 80 telescope operated at Teide Observatory of the Instituto de Astrofísica de Canarias. This publication makes use of data products from the Two Micron All Sky Survey, which is a joint project of the University of Massachusetts and the Infrared Processing and Analysis Center/California Institute of Technology, funded by the National Aeronautics and Space Administration and the National Science Foundation. This research has made use of the SIMBAD database, operated at CDS, Strasbourg, France. The team at the IAC acknowledges support by grants ESP2007-65480-C02-02 and AYA2010-20982-C02-02 of the Spanish Ministerio de Ciencia e Innovación. MONET (MOnitoring NEtwork of Telescopes) is funded by the “Astronomie & Internet” program of the Alfred Krupp von Bohlen und Halbach Foundation, Essen, and operated by the Georg-August-Universität Göttingen, McDonald Observatory of the University of Texas at Austin, and the South African Astronomical Observatory. TRAPPIST is funded by the Belgian Fund for Scientific Research (Fond National de la Recherche Scientifique, FNRS) under the grant FRFC 2.5.594.09.F, with the participation of the Swiss National Science Foundation (SNF). We are thankful to the Tautenburg observing team, particularly D. Sebastian, M. Ammler-von Eiff, B. Stecklum, and Ch. Högner, for helping us with the NASMYTH observations.
References
- Almenara, J. M., Deeg, H. J., Aigrain, S., et al. 2009, A&A, 506, 337 [NASA ADS] [CrossRef] [EDP Sciences] [Google Scholar]
- Alonso, R., Deeg, H. J., Brown, T. M., & Belmonte, J. A. 2004, Astron. Nachr., 325, 594 [NASA ADS] [CrossRef] [Google Scholar]
- Bilir, S., Karaali, S., Ak, S., et al. 2009, MNRAS, 396, 1589 [NASA ADS] [CrossRef] [Google Scholar]
- Brown, T. M. 2003, ApJ, 593, L125 [NASA ADS] [CrossRef] [Google Scholar]
- Cabrera, J., Fridlund, M., & Ollivier, M. 2009 A&A, 506, 501 [Google Scholar]
- Carone, L., Gandolfi, D., Cabrera, J., et al. 2012, A&A, 538, A112 [NASA ADS] [CrossRef] [EDP Sciences] [Google Scholar]
- Carpano, S., Cabrera, J., & Alonso, R. 2009, A&A, 506, 491 [NASA ADS] [CrossRef] [EDP Sciences] [Google Scholar]
- Cavarroc, C., Moutou, C., Gandolfi, D., et al. 2012, Ap&SS, 337, 511 [NASA ADS] [CrossRef] [Google Scholar]
- Colón, K. D., Ford, E. B., & Morehead, R. C. 2012, MNRAS, 426, 342 [NASA ADS] [CrossRef] [Google Scholar]
- Costes, V., & Perruchot, S. 2006, ESA SP, 1306, 155 [NASA ADS] [Google Scholar]
- Cutri, R. M., et al. 2003, VizieR Online Data Catalog, II/2246 [Google Scholar]
- Deeg, H. J., Gillon, M., Shporer, A., et al. 2009, A&A, 506, 343 [NASA ADS] [CrossRef] [EDP Sciences] [Google Scholar]
- Deleuil, M., Meunier, J. C., Moutou, C., et al. 2009, AJ, 138, 649 [NASA ADS] [CrossRef] [Google Scholar]
- Duquennoy, A., & Mayor, M. 1991, A&A, 248, 485 [NASA ADS] [Google Scholar]
- Erikson, A., Santerne, A., Renner, S., et al. 2012, A&A, 539, A14 [NASA ADS] [CrossRef] [EDP Sciences] [Google Scholar]
- Gillon M., Jehin E., Magain P., et al., 2011, in Detection and Dynamics of Transiting Exoplanets, Proc. OHP Colloquium (23−27 August 2010), eds. F. Bouchy, R. F. Diaz & C. Moutou (Platypus Press) [arXiv:1101.5807] [Google Scholar]
- Guenther, E. W., & Tal-Or, L. 2010, A&A, 521, A83 [NASA ADS] [CrossRef] [EDP Sciences] [Google Scholar]
- Guenther, E. W., Torres, G., Batalha, N., et al. 2001, A&A, 366, 965 [NASA ADS] [CrossRef] [EDP Sciences] [Google Scholar]
- Henry, T. J., Jao, W.-C., Subasavage, J. P., et al. 2006, AJ, 132, 2360 [NASA ADS] [CrossRef] [Google Scholar]
- Léger, A., Selsis, F., Sotin, C., et al. 2004, Icarus, 169, 499 [NASA ADS] [CrossRef] [Google Scholar]
- Léger, A., Rouan, D., Schneider, J., et al. 2009, A&A, 506, 287 [NASA ADS] [CrossRef] [EDP Sciences] [MathSciNet] [Google Scholar]
- Lépine, S., Thorstensen, J. R., Shara, M. M., & Rich, R. M. 2009, AJ, 137, 4109 [NASA ADS] [CrossRef] [Google Scholar]
- Levacher, P. 2006, ESA SP, 1306, 217 [NASA ADS] [Google Scholar]
- Lillo-Box, J., Barrado, D., & Bouy, H. 2012, A&A, 546, A10 [NASA ADS] [CrossRef] [EDP Sciences] [Google Scholar]
- Llebaria, A., & Guterman, P. 2006, ESA SP, 1306, 293 [Google Scholar]
- Morton, T. D., & Johnson, J. A. 2011, ApJ, 738, 170 [NASA ADS] [CrossRef] [Google Scholar]
- Santerne, A., Díaz, R. F., Moutou, C., et al. 2012, A&A, 545, A76 [NASA ADS] [CrossRef] [EDP Sciences] [Google Scholar]
- Skrutskie, M. F., Cutri, R. M., Stiening, R., et al. 2006, AJ, 131, 1163 [NASA ADS] [CrossRef] [Google Scholar]
- Tokovinin, A. 2008, MNRAS, 389, 925 [NASA ADS] [CrossRef] [Google Scholar]
- Wallace, L., & Livingston, W. C. 1992, NSO Technical Report #92-001 (Tucson: National Solar Observatory) [Google Scholar]
All Tables
All Figures
|
Fig. 1 NaCo images of objects with CCs were found. Top row from left to right: LRa01_E1_2101, LRa01_E1_4719, LRa03_E2_0861. Middle row from left to right: LRa02_E1_1715, LRa02_E2_1136, LRa04_E2_0626. Bottom row: LRc07_E2_0158. North is up and east is left in all images. The dark line corresponds to one arcsec. Details about the object are given in Table 2. |
| In the text | |
|
Fig. 2 Part of the CRIRES spectrum of LRa01_E1_2101 and a spectrum of a sunspot for comparison. The CO lines are seen in both spectra. |
| In the text | |
|
Fig. 3 Cross-correlation function of LRa01_E1_2101 (full line) together with a simulated cross-correlation function of LRa01_E1_2101 with a hypothetical M3V star added (dashed line). An M3V companion can thus be excluded. |
| In the text | |
|
Fig. 4 Colour−magnitude diagram of the two stars of LRa_E1_4719 (big dots). For comparison, we also show the brightness and J − K colour of standard stars (small dots) as given in Lépine et al. (2009), Henry et al. (2006), and Bilir et al. (2009). |
| In the text | |
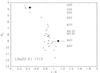 |
Fig. 5 Same as Fig. 4 but for LRa_E1_1715. |
| In the text | |
|
Fig. 6 Colour−magnitude diagram of the two stars of LRa02_E2_1136. |
| In the text | |
|
Fig. 7 Positions and brightnesses of all stars detected by NaCo other than the targets in the anti-centre fields. There is a notable excess of stars within 2′′ of the targets. |
| In the text | |
|
Fig. 8 Distribution of binaries in the solar neighbourhood taken from Duquennoy & Mayor (1991). The dashed lines indicate the projected distances of the companion candidates, assuming that they are physical companions. |
| In the text | |
|
Fig. B.1 Part of the CRIRES spectrum of LRa02_E1_4601 taken with the first setting, together with a spectrum of the Sun and a sunspot. |
| In the text | |
|
Fig. B.2 Part of the CRIRES spectrum of LRa02_E1_4601 taken with the second setting, together with a spectrum of the Sun and a sunspot. |
| In the text | |
|
Fig. B.3 Spectral energy distribution of LRa02_E1_4601. There is no excess in the IR. This is consistent with the NaCo and CRIRES results that the third object of this system is not a star. |
| In the text | |
|
Fig. B.4 NaCo image of LRc02_E1_0591 taken in the J-band. Marked as PFP 1, 2, 3 are stars that became fainter during the transit (“potential FP”). See also Table B.1. North is up and east is left. |
| In the text | |
Current usage metrics show cumulative count of Article Views (full-text article views including HTML views, PDF and ePub downloads, according to the available data) and Abstracts Views on Vision4Press platform.
Data correspond to usage on the plateform after 2015. The current usage metrics is available 48-96 hours after online publication and is updated daily on week days.
Initial download of the metrics may take a while.