Fig. A.1
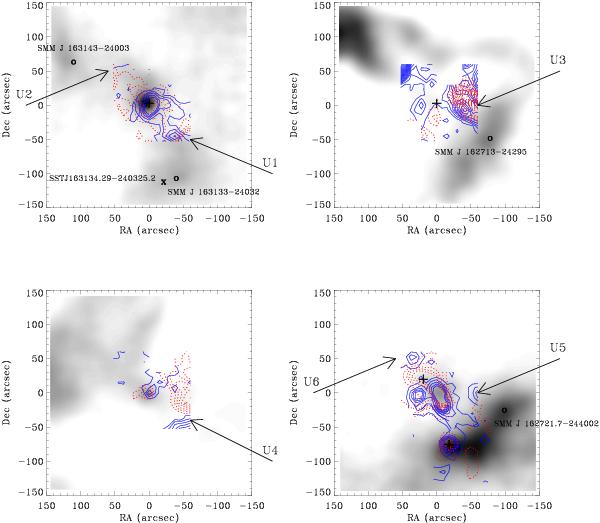
Regions around the new outflow structures (Us), showing the SCUBA 850 μm emission in the background, the contour map of the integrated line wings, the sources from the sample in this study marked with pluses and the Us indicated with arrows. The nearby submillimeter cores are marked with circles and infrared sources with a cross. (Top left) The region around IRS 63. (Top right) The region around IRS 37. (Bottom left) The region around WL 12. (Bottom right) The region around IRS 44.
Current usage metrics show cumulative count of Article Views (full-text article views including HTML views, PDF and ePub downloads, according to the available data) and Abstracts Views on Vision4Press platform.
Data correspond to usage on the plateform after 2015. The current usage metrics is available 48-96 hours after online publication and is updated daily on week days.
Initial download of the metrics may take a while.