Fig. 8
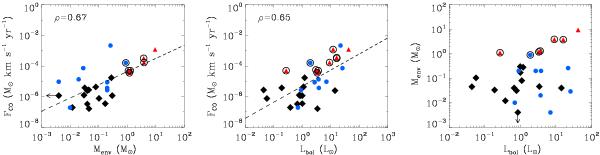
Correlation plots for the outflow force FCO using M1, bolometric luminosity Lbol and the mass of the envelope Menv. Black diamonds are from this study, red triangles from CB92, and blue circles from Hogerheijde et al. (1998), where FCO was calculated by the same method as in this study. The Class 0 sources are encircled. Upper limits are indicated with arrows. The dashed line indicates the best fits to the combined data set.
Current usage metrics show cumulative count of Article Views (full-text article views including HTML views, PDF and ePub downloads, according to the available data) and Abstracts Views on Vision4Press platform.
Data correspond to usage on the plateform after 2015. The current usage metrics is available 48-96 hours after online publication and is updated daily on week days.
Initial download of the metrics may take a while.