Fig. 3
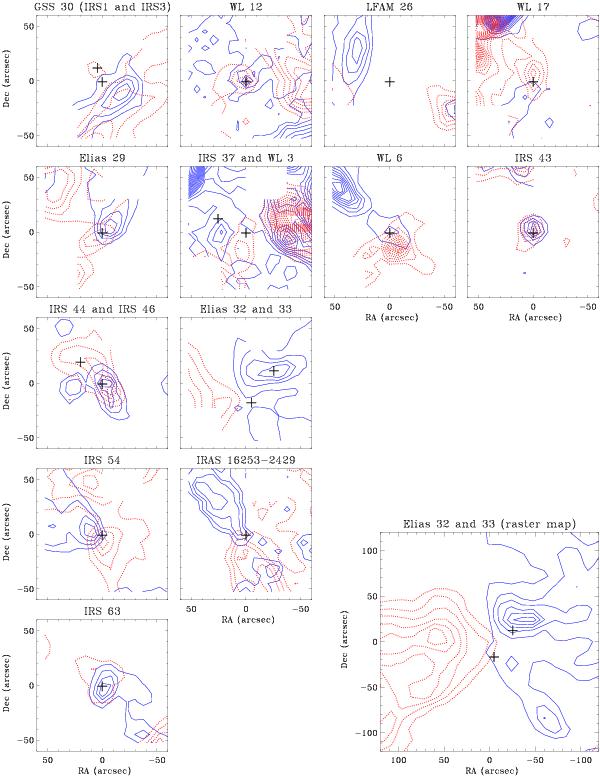
Outflow maps of all sources. Contours are drawn based on the integrated intensities of the line wings. Contours are drawn at 20, 40, 60, 80 and 100% of the peak value of the integrated intensity of the target source. The source positions are marked by pluses. Two receivers were broken at the time of observation, resulting in lack of data in the southeast and north-northwest corner of each map. In maps with Elias 32 and 33, Elias 32 is northwest of Elias 33. In the GSS 30 map, GSS 30-IRS3 is north of GSS 30-IRS1. In the IRS 37 map, WL 3 is east of IRS 37. In the IRS 44 map, IRS 46 is northeast of IRS 44.
Current usage metrics show cumulative count of Article Views (full-text article views including HTML views, PDF and ePub downloads, according to the available data) and Abstracts Views on Vision4Press platform.
Data correspond to usage on the plateform after 2015. The current usage metrics is available 48-96 hours after online publication and is updated daily on week days.
Initial download of the metrics may take a while.