Free Access
Fig. 2
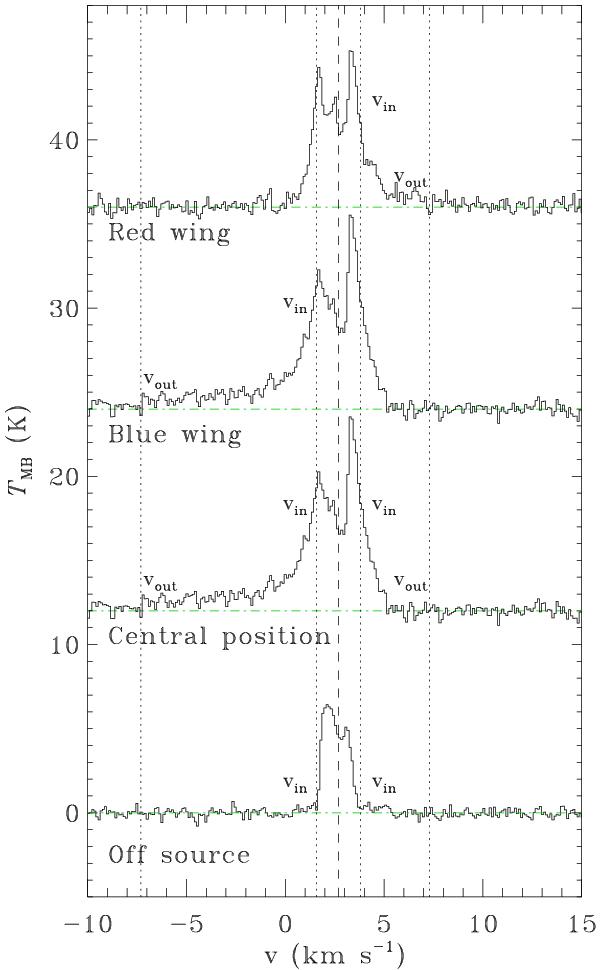
12CO 3–2 spectra toward IRS 63, from top to bottom: one red outflow lobe position (15″, 15″), one blue outflow lobe position (0″,  5), the central position (0″, 0″) and one off-source position (
 5, 20″). The integration limits are marked by dotted lines, baselines by dash-dotted lines and the source velocity by a dashed line.
Current usage metrics show cumulative count of Article Views (full-text article views including HTML views, PDF and ePub downloads, according to the available data) and Abstracts Views on Vision4Press platform.
Data correspond to usage on the plateform after 2015. The current usage metrics is available 48-96 hours after online publication and is updated daily on week days.
Initial download of the metrics may take a while.