Fig. 1
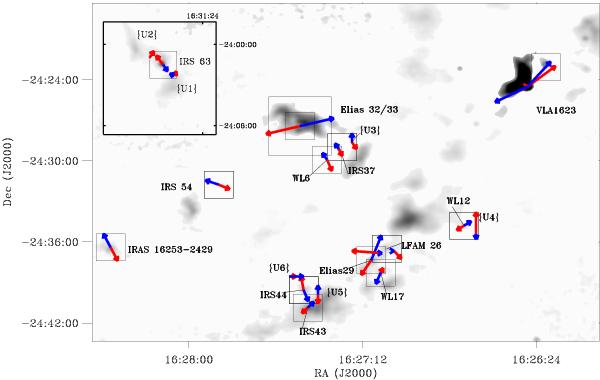
L1688 core in Ophiuchus and the region around IRS 63 (inset upper left corner). The background shows the 850 μm SCUBA map (Johnstone et al. 2000; Di Francesco et al. 2008). The locations of all observed HARP maps are indicated by squares, labeled by the sources within. The blue and red arrows indicate the direction and observed extent of the blue and red outflow of that source, except for the extent of VLA 1623, which was taken from Yu & Chernin (1997) who observed the region centered on VLA 1623. In crowded regions, lines connect the source names to the origin location of the outflow. Newly detected outflow structures without a driving source are marked with Us.
Current usage metrics show cumulative count of Article Views (full-text article views including HTML views, PDF and ePub downloads, according to the available data) and Abstracts Views on Vision4Press platform.
Data correspond to usage on the plateform after 2015. The current usage metrics is available 48-96 hours after online publication and is updated daily on week days.
Initial download of the metrics may take a while.