| Issue |
A&A
Volume 556, August 2013
|
|
|---|---|---|
| Article Number | A4 | |
| Number of page(s) | 12 | |
| Section | Stellar structure and evolution | |
| DOI | https://doi.org/10.1051/0004-6361/201220391 | |
| Published online | 16 July 2013 | |
Mass transfer in eccentric binary systems using the binary evolution code BINSTAR
Institut d’Astronomie et d’Astrophysique (IAA), Université Libre de
Bruxelles, ULB, CP226, Boulevard du Triomphe, 1050 Brussels, Belgium
e-mail:
This email address is being protected from spambots. You need JavaScript enabled to view it.
Received:
17
September
2012
Accepted:
24
May
2013
Abstract
Context. Studies of interacting binary systems typically assume that tidal forces have circularized the orbit by the time Roche lobe overflow (RLOF) commences. However, recent observations of ellipsoidal variables have challenged this assumption.
Aims. We present the first calculations of mass transfer via RLOF for a binary system with a significant eccentricity using our new binary stellar evolution code. The study focuses on a 1.50+1.40 M⊙ main sequence binary with an eccentricity of 0.25, and an orbital period of Porb ≈ 0.7 d. The reaction of the stellar components due to mass transfer is analysed, and the evolution of mass transfer during the periastron passage is compared to recent smooth particle hydrodynamics (SPH) simulations. The impact of asynchronism and non-zero eccentricity on the Roche lobe radius, and the effects of tidal and rotational deformation on the stars’ structures, are also investigated.
Methods. Calculations were performed using the state-of-the-art binary evolution code BINSTAR, which calculates simultaneously the structure of the two stars and the evolution of the orbital parameters.
Results. The evolution of the mass transfer rate during an orbit has a Gaussian-like shape, with a maximum at periastron, in qualitative agreement with SPH simulations. The Roche lobe radius is modified by the donor star’s spin and the orbital eccentricity. This has a significant impact on both the duration and the rate of mass transfer. We find that below some critical rotation rate, mass transfer never occurs, while above some threshold, mass is transferred over the entire orbit. Tidal and rotational deformation of the donor star causes it to become over-sized, enhancing the mass transfer rate further by up to about a factor of ten, leading to non-conservative mass transfer. The modulation of the mass transfer rate with orbital phase produces short-term variability in the surface luminosity and radius of each star. The longer-term behaviour shows, in accordance with studies of circular systems with radiative stars, that the donor becomes ever small and under-luminous, while the converse is the case for the accretor.
Key words: binaries: general - binaries: close / stars: evolution / methods: numerical
© ESO, 2013
1. Introduction
Roche lobe overflow (RLOF) is of fundamental importance for a wide variety of binary star systems (for a review see Pringle 1985), such as cataclysmic variables, low-mass X-ray binaries and Algols. RLOF impacts upon both the binary orbit through the exchange (or perhaps the loss from the system) of mass and angular momentum, and on the evolution of the stellar components themselves, which may lead to a variety of exotic events. Accretion onto a high-mass white dwarf, for example, may lead to Type Ia supernovae (see Wang & Han 2012, for a review), or novae events (see e.g. Warner 1995). Alternatively, a common envelope phase is expected to result from RLOF from a red or asymptotic giant branch star (Pazcynski 1976). Clearly, the outcome of binary evolution greatly depends upon both the rate at which material is transferred, and upon the nature of the stars.
Briefly, during RLOF, material from the donor (with mass M1) is channelled as a narrow stream through the inner Lagrangian point, ℒ1, which falls into the gravitational potential well of the accretor (mass M2). Depending on the initial separation, the matter stream will either impact directly onto the surface of the companion star, or form an accretion disk around it. The mass transfer rate through the ℒ1 point is determined by how much the star over-fills its Roche lobe, which in turn is dictated by the Roche lobe geometry and the donor’s structure (see Ritter 1988; D’Antona et al. 1989).
The validity of the Roche model rests on three assumptions: that the stellar components can be treated as point masses, that the orbit is circular and that the donor star is rotating synchronously with the orbit. Studies of binaries undergoing RLOF generally consider that the last two of these assumptions hold by the time RLOF commences (e.g. Willems & Kolb 2004), the reason being that tidal forces act on very short timescales, owing to the strong dependence of the tidal torques on the ratio of the stellar radius with the orbital separation (Zahn 1977). Therefore, tides will have circularized the orbit, and synchronized the donor star with the orbit, by the time RLOF starts.
However, the assumption of circular orbits for RLOF has been challenged by observations. Petrova & Orlov (1999) compiled a catalogue of 128 eccentric binaries which reveals that approximately 15 per cent of these systems are semi-detached, while 5 per cent have evolved into contact. Nicholls & Wood (2012) confirmed large eccentricities, between 0.14 and 0.42, among seven ellipsoidal variables. This is a surprising result because these systems, which are close to filling their Roche lobes, should be nearly circular given their short separation and the efficiency of the tidal torques. These observations suggest that some of these binaries will therefore fill their Roche lobes while still possessing eccentric orbits. The idea of episodic mass transfer at periastron corroborates the hypothesis of Jorissen et al. (2009) to explain the evolution of KIII-type giants on the eccentricity-orbital period plane.
From a theoretical point of view, the assumption of a circular orbit with a synchronously rotating donor star during RLOF has also been called into question by Sepinsky et al. (2007b; 2009). They investigated the secular orbital evolution of an eccentric binary with a 1.44 M⊙ neutron star paired with a range of donor masses, as a result of both conservative and non-conservative mass transfer via RLOF at periastron. They compared the timescale for the evolution of the eccentricity due to tides and RLOF and found that, in contrast to tides which always act to circularize the orbit, mass transfer may either increase or decrease the eccentricity, over timescales ranging from a few Myr to a Hubble time. Furthermore, the timescale over which mass transfer acts to increase the eccentricity may be shorter than the tidal timescale which acts to decrease it. This occurs for mass ratios q = M1/M2 ≲ 0.6, which lies in the low-mass binary regime. Similar behaviour was also found by Sepinsky et al. (2010) who studied the orbital evolution of eccentric binaries by investigating the gravitational interaction between the matter stream and the stellar components. Hence, it is not guaranteed that mass transfer will circularize the orbit.
The eccentric nature of the binary orbit also means that the Roche model assumptions (i.e. where circular orbits and synchronous rotation is assumed) no longer applies (e.g. Limber 1963; Savonije 1978). Sepinsky et al. (2007a) analysed the effect of eccentricity and asynchronism on the Roche geometry. They found that the Roche lobe radius for a donor star which is rotating super-synchronously with the orbital motion at periastron will be smaller than the radius calculated using the classical Eggleton (1983) formula. The converse is true for a sub-synchronously rotating donor star. As pointed out by Lajoie & Sills (2011b, henceforth LS11) this will impact upon both the rate and duration of mass transfer.
The recent attempts to simulate mass transfer in eccentric binaries have all used SPH techniques (e.g. Regős et al. 2005; Church et al. 2009; Lajoie & Sills 2011a, LS11), and did not consider the possibility to address the problem using a binary stellar evolution code, which can accurately model the internal structure of the stellar components. To the best of our knowledge, only Edwards & Pringle (1987) have attempted to calculate RLOF in eccentric binaries analytically. However, they considered a binary with a small eccentricity of 5 × 10⁻⁴, and only modelled the flow in the vicinity of the ℒ1 point.
In this paper, we present the first simulation of mass transfer for significantly eccentric systems using the state-of-the-art binary evolution code BINSTAR (Siess et al. 2013). To facilitate comparisons with the work by LS11, we consider their 1.50+1.40 M⊙ binary, with an eccentricity of e = 0.25. In the light of the study by Sepinsky et al. (2007a) we investigate the affect of asynchronous rotation and eccentricity on the Roche lobe radius, and how this impacts on the mass transfer rate. We also examine the response of the structure of each star due to mass transfer, and to the deformation caused by rotation and tides. The secular orbital evolution of the binary system is deferred to a future study.
The paper is structured as follows. In Sect. 2, we describe the BINSTAR code, how we calculate the Roche lobe radii, the mass transfer rate, and how we account for the effects of rotation and tides on the stellar structure. Our results are presented in Sect. 3, which are discussed in Sect. 4. We conclude with a summary of our investigation in Sect. 5.
2. Computational method
BINSTAR is an extension of the single star evolution code STAREVOL. For further details regarding the stellar input physics, we refer the reader to Siess et al. (2000) and Siess (2006; 2007; 2009; 2010), and references therein.
In the following sections, we describe the key binary input physics used in this investigation. For a thorough description of the BINSTAR code, we refer the reader to Siess et al. (2013).
2.1. Roche lobe radius
In an eccentric orbit, the separation between the two stellar components,
D, changes with time. For an orbit with a semi-major axis
a and an eccentricity e, D is found
from  (1)where
ν is the true anomaly. Accordingly, the Roche lobe radius of the donor
star, Rℒ1, will change along the orbit. The
expression for Rℒ1 as given by Eggleton (1983) can be modified by replacing a
with D, i.e.
(1)where
ν is the true anomaly. Accordingly, the Roche lobe radius of the donor
star, Rℒ1, will change along the orbit. The
expression for Rℒ1 as given by Eggleton (1983) can be modified by replacing a
with D, i.e.  (2)Henceforth, we term
this the standard Roche lobe formalism.
(2)Henceforth, we term
this the standard Roche lobe formalism.
However, this formula is strictly valid only for circular orbits and for donors, which
are rotating synchronously with the orbit. We follow Sepinsky et al. (2007a) and calculate
Rℒ1 by taking the eccentricity of the orbit and
any asynchronism of the donor star into account. The potential in this case (normalized to
the gravitational potential of the accretor,  )
is given by (Sepinsky et al. 2007a)
)
is given by (Sepinsky et al. 2007a) ![Mathematical equation: \begin{eqnarray} \Psi(x,y,z)&=&-\frac{q}{\left(x^{2}+y^{2}+z^{2}\right)^{\frac{1}{2}}}-\frac{1}{\left[(x-1)^{2}+y^{2}+z^{2}\right]^{\frac{1}{2}}} \nonumber \\ &&-\,\frac{1}{2}\mathcal{A}(1+q)(x^{2}+y^{2})+x, \label{Psi} \end{eqnarray}](/articles/aa/full_html/2013/08/aa20391-12/aa20391-12-eq17.png) (3)where
the x-axis lies along the line joining the centres of mass of the two
stars, in the direction from the donor to the accretor, the z-axis is
perpendicular to the plane of the orbit and is parallel to the spin angular velocity of
the donor, and the y-axis is perpendicular to the
x-axis, and completes a right-handed coordinate set. All coordinates are
given in units of D. In Eq. (3)
(3)where
the x-axis lies along the line joining the centres of mass of the two
stars, in the direction from the donor to the accretor, the z-axis is
perpendicular to the plane of the orbit and is parallel to the spin angular velocity of
the donor, and the y-axis is perpendicular to the
x-axis, and completes a right-handed coordinate set. All coordinates are
given in units of D. In Eq. (3)  (4)quantifies
the degree of asynchronism and eccentricity, and f is the spin angular
speed of the donor star in units of the orbital angular speed at periastron, i.e.
(4)quantifies
the degree of asynchronism and eccentricity, and f is the spin angular
speed of the donor star in units of the orbital angular speed at periastron, i.e.
 (5)Here, the orbital
angular speed, ω, is given by
(5)Here, the orbital
angular speed, ω, is given by  (6)where
Porb is the orbital period. Since, in general, the potential
in an eccentric system is varying with time, this will induce oscillations of mass
elements inside the star, and perturb its hydrostatic equilibrium. However, Sepinsky et
al. (2007a) show that such motions are negligible
if the dynamical timescale,
(6)where
Porb is the orbital period. Since, in general, the potential
in an eccentric system is varying with time, this will induce oscillations of mass
elements inside the star, and perturb its hydrostatic equilibrium. However, Sepinsky et
al. (2007a) show that such motions are negligible
if the dynamical timescale,  of the
donor is much less than the tidal timescale,
τtide = 2π/|ω − Ω1 |,
in which case the instantaneous shape of the star can be approximated by the instantaneous
surfaces of constant Ψ (e.g. Limber 1963; Savonije
1978). This so-called “first approximation” is
valid for main sequence stars where Porb ≳ 10 h (Sepinsky et
al. 2007a), hence for our 0.7 d system.
of the
donor is much less than the tidal timescale,
τtide = 2π/|ω − Ω1 |,
in which case the instantaneous shape of the star can be approximated by the instantaneous
surfaces of constant Ψ (e.g. Limber 1963; Savonije
1978). This so-called “first approximation” is
valid for main sequence stars where Porb ≳ 10 h (Sepinsky et
al. 2007a), hence for our 0.7 d system.
Sepinsky et al. (2007a) provide fit formulae for
Rℒ1 as a function of
 and q for eccentric orbits and asynchronous donors. However, because of
discontinuities in some regions of the
and q for eccentric orbits and asynchronous donors. However, because of
discontinuities in some regions of the  parameter space (Sepinsky, priv. comm.), the volume of the Roche lobe is calculated
numerically using a 32-point Gaussian quadrature integration technique (Press et al. 1990), from which we derive the equivalent Roche lobe
radius.
parameter space (Sepinsky, priv. comm.), the volume of the Roche lobe is calculated
numerically using a 32-point Gaussian quadrature integration technique (Press et al. 1990), from which we derive the equivalent Roche lobe
radius.
2.2. Calculating mass transfer rates
To calculate the mass transfer rates during each periastron passage, we follow the prescription outlined in Ritter (1988) and Kolb & Ritter (1990).
We consider a donor star of mass M1, radius
R1, effective temperature
Teff,1, and with a mean molecular weight
and density at the photosphere, μph,1 and
ρph,1, respectively. The mass transfer
rate, Ṁ1, in the case where material is removed from the
optically thin region of the donor’s atmosphere (i.e. where the optical depth is
 ) is
calculated using
) is
calculated using  (7)(Ritter 1988) where
ĤP = HP/γ
is the pressure scale height of the donor at the location of ℒ1, which can be
calculated from the pressure scale height at the photosphere,
HP, and a correction factor, γ, which
accounts for the geometry of the Roche lobe (see Appendix A). Also, Ṁ0 is the mass transfer rate if the donor
star exactly fills its Roche lobe, and is given by
(7)(Ritter 1988) where
ĤP = HP/γ
is the pressure scale height of the donor at the location of ℒ1, which can be
calculated from the pressure scale height at the photosphere,
HP, and a correction factor, γ, which
accounts for the geometry of the Roche lobe (see Appendix A). Also, Ṁ0 is the mass transfer rate if the donor
star exactly fills its Roche lobe, and is given by  (8)Here, ℛ is the
ideal gas constant, G is the gravitational constant and
F(q) is a function of q, and is
determined from the area of the equipotential surface which intersects with the
ℒ1 point:
(8)Here, ℛ is the
ideal gas constant, G is the gravitational constant and
F(q) is a function of q, and is
determined from the area of the equipotential surface which intersects with the
ℒ1 point: ![Mathematical equation: \begin{equation} F(q)=q\,\hat{\beta}^{-3}\left\{ g(q)\left[g(q)-1-q\right]\right\} ^{-1/2}. \label{Fq} \end{equation}](/articles/aa/full_html/2013/08/aa20391-12/aa20391-12-eq50.png) (9)In turn,
(9)In turn,
 ,
and g(q) is given by
,
and g(q) is given by  (10)where
xℒ1 is the distance from the centre of mass of
the donor star to the ℒ1 point, in units of D. For the Roche
model, xℒ1 can be determined by numerically solving
(10)where
xℒ1 is the distance from the centre of mass of
the donor star to the ℒ1 point, in units of D. For the Roche
model, xℒ1 can be determined by numerically solving
 (11)(Sepinsky et al. 2007a), with
  for synchronously rotating stars in circular orbits.
If the donor is significantly overflowing its Roche lobe, or if the donor’s radius and
Roche lobe radius are not evolving in step, then Eq. (7) is no longer valid. Instead, mass is also lost from the optically
thick layers of the star (where τ ≳ 2/3). The mass
transfer rate in this case becomes (see also Deloye et al. 2007)  (12)where
P, T, μ and
Mr is the pressure, temperature, mean
molecular weight and the mass of the donor star respectively at the radial coordinate
r, and
Γ1 = (d lnP/d lnρ)ad
is the adiabatic exponent. The integral in Eq. (12) is evaluated numerically from the ℒ1 point to the photosphere
(subscript “ph”).
(12)where
P, T, μ and
Mr is the pressure, temperature, mean
molecular weight and the mass of the donor star respectively at the radial coordinate
r, and
Γ1 = (d lnP/d lnρ)ad
is the adiabatic exponent. The integral in Eq. (12) is evaluated numerically from the ℒ1 point to the photosphere
(subscript “ph”).
If the donor star is rotating asynchronously with the orbit, and the eccentricity is
non-zero, Eq. (9) is modified according to
(see Appendix A) ![Mathematical equation: \begin{equation} F^{*}(q,\mathcal{A})=q\hat{\beta}^{-3}\left\{g(q)\left[g(q)-\mathcal{A}-q\mathcal{A}\right]\right\}^{-\frac{1}{2}}\!, \label{F_star} \end{equation}](/articles/aa/full_html/2013/08/aa20391-12/aa20391-12-eq65.png) (13)where the asterisk makes
the distinction from Eq. (9).
(13)where the asterisk makes
the distinction from Eq. (9).
2.3. Initial model
2.3.1. The binary model
To compare our results with the SPH simulations of LS11, we consider their 1.50+1.40 M⊙ main sequence binary system configuration. They construct their SPH models from the theoretical density profiles of a 1.50 M⊙ donor star with a 1.40 M⊙ accreting companion, calculated from their stellar evolution code, YREC (Guenther et al. 1992; see LS11 for further details).
Their stars have a metallicity of Z = 0.001, and an age of approximately 1.3 Gyr, representative of binary systems populating old open clusters. They use a mixing length parameter αMLT = 1.71, with no convective overshooting or rotation (Sills, priv. comm.). With their input physics, we find that the donor and accretor have a radius of approximately 1.4 and 1.2 R⊙ respectively, in agreement with LS11. We also follow LS11 and synchronize the spin angular velocity of the stars to the orbital angular speed at apastron, yielding f ≈ 0.36. The surface angular speed of the stellar components is then Ω1 = Ω2 ≈ 6 × 10⁻⁵ s-1. For simplicity, we assume that the stars rotate as solid bodies, since the treatment of differential rotation is beyond the scope of the paper.
Pertinent to this study, we find that each star possesses a thin surface convective envelope, due to the first ionization of hydrogen. Their radial extents are relatively small (approximately 0.0014 R⊙ for the 1.50 M⊙ donor, and 0.002 R⊙ for the 1.40 M⊙ accretor), and their masses negligible, but they are crucial for understanding the response of the stellar structure to mass changes (see Sect. 3.2). Each star also has two additional convection zones1 associated with the first and second ionization of helium, but they play a secondary role. Henceforth, we denote the zone associated with the ionization of hydrogen as the surface convection zone. The upper layers of this convective region are super-adiabatic and energy transport via convection becomes increasingly inefficient, until all the flux is transported purely by radiation in the atmosphere. To aid numerical stability, the number of shells in the donor and accretor are kept constant and are equal to 818 and 847, respectively.
2.3.2. Integrating the orbit
With an eccentricity, e = 0.25 and a semi-major axis, a = 4.80 R⊙, the orbital separation at periastron is rperi = 3.60 R⊙, and the orbital period Porb ≈ 0.7 days.
To resolve numerically the orbital motion, we impose the evolutionary timestep
Δt not to exceed some fraction, ℱorb, of the time it takes
for the stars to travel the circumference 2πa, given a value
vorb of the orbital speed at that orbital phase i.e.
 (14)with
  (15)For our simulations, we
use ℱorb = 5 × 10⁻³, which give us timesteps of approximately
10-6 yr.
(15)For our simulations, we
use ℱorb = 5 × 10⁻³, which give us timesteps of approximately
10-6 yr.
2.4. Treatment of mass loss and mass gain
In the surface layers of the star, variations in the luminosity result from the release
of gravo-thermal energy per unit time and per unit mass 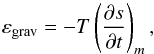 (16)where
s is the specific entropy, and the subscript m denotes
that the derivative is evaluated at a fixed mass coordinate. In the situation where mass
is lost or gained by the star, mass and time can no longer be considered as independent
variables. Following Neo et al. (1977) we use a
pseudo-Lagrangian variable,
(16)where
s is the specific entropy, and the subscript m denotes
that the derivative is evaluated at a fixed mass coordinate. In the situation where mass
is lost or gained by the star, mass and time can no longer be considered as independent
variables. Following Neo et al. (1977) we use a
pseudo-Lagrangian variable,  ,
for each star i = 1, 2, which is defined as
,
for each star i = 1, 2, which is defined as
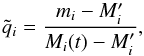 (17)where
 is the mass
coordinate above which mass is lost or gained,
mi is a mass coordinate located at
is the mass
coordinate above which mass is lost or gained,
mi is a mass coordinate located at
 and
Mi(t) is the stellar mass
at time t. In those layers affected by a change in mass,
varies between 0 and 1. For the donor, we take the value of
and
Mi(t) is the stellar mass
at time t. In those layers affected by a change in mass,
varies between 0 and 1. For the donor, we take the value of
 to coincide
with the location of the Roche lobe radius inside the star. We ensure that the time-step,
Δt, is small enough such that
to coincide
with the location of the Roche lobe radius inside the star. We ensure that the time-step,
Δt, is small enough such that  . For the
accretor, mass is deposited uniformly above the mass coordinate corresponding to a
fraction faccr of the accretor’s mass. Hence,
. For the
accretor, mass is deposited uniformly above the mass coordinate corresponding to a
fraction faccr of the accretor’s mass. Hence,
 , where we
arbitrarily set faccr = 0.9. We find that the response of the
accretor to mass gain is independent of the value of faccr.
, where we
arbitrarily set faccr = 0.9. We find that the response of the
accretor to mass gain is independent of the value of faccr.
In this scheme, Eq. (16) can be re-cast
as (see Neo et al. 1977; Fujimoto & Iben
1989) 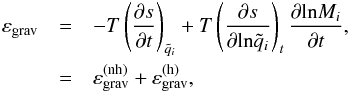 (18)where
the subscripts
and t, indicate that the derivatives are to be evaluated at constant
and t, respectively. The first and second terms on the right hand side of
Eq. (18) correspond to the non-homologous,
(18)where
the subscripts
and t, indicate that the derivatives are to be evaluated at constant
and t, respectively. The first and second terms on the right hand side of
Eq. (18) correspond to the non-homologous,
 , and
homologous,
, and
homologous,  ,
gravo-thermal energy generation rates, respectively.
,
gravo-thermal energy generation rates, respectively.
The gravo-thermal luminosity, Lgrav, is then the sum of the
non-homologous,  , and
homologous,
, and
homologous,  ,
contributions given by
,
contributions given by 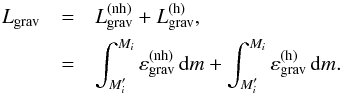 (19)It
is unclear what fraction, 0 ≤ αacc ≤ 1, of the accretion
luminosity, Lacc, is imparted to the stellar layers, and what
fraction is radiated away. For the case of direct-impact accretion Ulrich & Burger
(1976) argue that, due to the small fraction of
the accretor’s surface that is covered by the hot-spot, the energy dissipated from the
shock region will have a negligible effect on the internal structure of the star. For disc
accretion, it is uncertain what fraction of the luminosity emitted from the star-disc
boundary layer is absorbed by the accretor (e.g. Siess et al. 1997). As shown in Sect. 3.3,
however, accretion occurs via direct impact. Hence, following e.g. Kippenhahn &
Meyer-Hofmeister (1977), Tout et al. (1999), Braun & Langer (1995), we assume that the accreted mass has the same specific entropy as
the shell in which it is deposited.
(19)It
is unclear what fraction, 0 ≤ αacc ≤ 1, of the accretion
luminosity, Lacc, is imparted to the stellar layers, and what
fraction is radiated away. For the case of direct-impact accretion Ulrich & Burger
(1976) argue that, due to the small fraction of
the accretor’s surface that is covered by the hot-spot, the energy dissipated from the
shock region will have a negligible effect on the internal structure of the star. For disc
accretion, it is uncertain what fraction of the luminosity emitted from the star-disc
boundary layer is absorbed by the accretor (e.g. Siess et al. 1997). As shown in Sect. 3.3,
however, accretion occurs via direct impact. Hence, following e.g. Kippenhahn &
Meyer-Hofmeister (1977), Tout et al. (1999), Braun & Langer (1995), we assume that the accreted mass has the same specific entropy as
the shell in which it is deposited.
For the models presented in Sects. 3.1 and 3.2, we also assume that mass transfer is fully conservative, i.e. β = |Ṁ2/Ṁ1| = 1. We investigate the possibility of relaxing this assumption further in Sect. 3.3.
2.5. Effects of tides and rotation on the stellar structure
To account for the deformation of the stellar structure caused by tidal and rotational forces, we implemented the prescription described by Landin et al. (2009), and Song et al. (2009). Their method employs the technique developed by Kippenhahn & Thomas (1970, henceforth KT70), and improved by Endal & Sofia (1978), to quantify the distortion of the star in a 1-dimensional stellar evolution code.
Consider an equipotential, Ψ, of surface SΨ and volume
VΨ, which encloses a mass MΨ.
Following KT70, the stellar structure equations are modified by applying the correction
factors fP and fT, which are
respectively given by 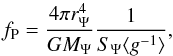 (20)and
 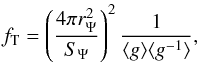 (21)where
rΨ is the radius of a sphere with volume
VΨ. The effective gravities, averaged over
SΨ, are given by
(21)where
rΨ is the radius of a sphere with volume
VΨ. The effective gravities, averaged over
SΨ, are given by 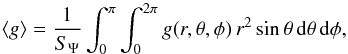 (22)where the local
gravity, g(r,θ,φ), is obtained by differentiating the
potential at the considered location, P(r,θ,φ), i.e.
(22)where the local
gravity, g(r,θ,φ), is obtained by differentiating the
potential at the considered location, P(r,θ,φ), i.e.
![Mathematical equation: \begin{equation} g(r,\theta,\phi)=\left[\left(\frac{\partial\Psi}{\partial r}\right)^{2}+\left(\frac{1}{r}\frac{\partial\Psi}{\partial\theta}\right)^{2}+\left(\frac{1}{r\sin\theta}\frac{\partial\Psi}{\partial\phi}\right)^{2}\right]^{1/2}\cdot \label{g_eff} \end{equation}](/articles/aa/full_html/2013/08/aa20391-12/aa20391-12-eq123.png) (23)In this expression,
the potential consists of four contributions; the spherically symmetric part of the
gravitational potential, Ψgrav, the cylindrically symmetric potential due to
rotation, Ψrot, the potential due to tides Ψtide and the
(non-symmetric) gravitational potential due to the distortion of the star resulting from
rotation, Ψdist,tide and tides
Ψdist,rot, and can be written
(23)In this expression,
the potential consists of four contributions; the spherically symmetric part of the
gravitational potential, Ψgrav, the cylindrically symmetric potential due to
rotation, Ψrot, the potential due to tides Ψtide and the
(non-symmetric) gravitational potential due to the distortion of the star resulting from
rotation, Ψdist,tide and tides
Ψdist,rot, and can be written ![Mathematical equation: \begin{eqnarray} \Psi(r,\theta,\phi)& =& \Psi_{\mathrm{grav}}+\Psi_{\mathrm{rot}}+\Psi_{\mathrm{tide}}+\Psi_{\mathrm{dist,rot}}+\Psi_{\mathrm{dist,tide}},\nonumber \\ & = & \frac{GM_{\Psi}}{r}+\frac{1}{2}\Omega_{1}^{2}r^{2}\sin^{2}\theta+\frac{GM_{\mathrm{2}}}{D}\left[1+\sum_{j=2}^{4}\left(\frac{r_{0}}{D}\right)^{j}\mathcal{P}_{j}(\lambda)\right]\nonumber \\ & & -\frac{4\pi}{3r^{3}}\mathcal{P}_{2}(\cos\theta)\,\mathcal{J}+4\pi GM_{\mathrm{2}}\sum_{j=2}^{4}\frac{\mathcal{P}_{j}(\lambda)}{(r\, D)^{j+1}}\,\mathcal{I}_{j}, \label{psi_rot_tide} \end{eqnarray}](/articles/aa/full_html/2013/08/aa20391-12/aa20391-12-eq129.png) (24)where
λ ≡ sinθ cosφ, r
is the distance from the centre of the star to P(r,θ,φ)
and
(24)where
λ ≡ sinθ cosφ, r
is the distance from the centre of the star to P(r,θ,φ)
and  is the jth Legendre polynomial. The integrals
 and ℐj are respectively given by
 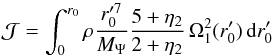 (25)and
 (26)for
j = 2,3,4 (Kopal 1959). In Eqs. (24) to (26),
r0 is the mean radius of the considered equipotential
surface, and ηj is determined numerically by
solving the Radau equation
(26)for
j = 2,3,4 (Kopal 1959). In Eqs. (24) to (26),
r0 is the mean radius of the considered equipotential
surface, and ηj is determined numerically by
solving the Radau equation  (27)using the
boundary condition
ηj(0) = j − 2 (see Landin et
al. 2009; and Song et al. 2009, for details). In Eq. (27),
(27)using the
boundary condition
ηj(0) = j − 2 (see Landin et
al. 2009; and Song et al. 2009, for details). In Eq. (27),  is the mean density at
r0.
is the mean density at
r0.
Note that in their study, Song et al. (2009) only use the above prescription to the interior of the star, while an analytical approximation is applied at the surface (Song, priv. comm.). Furthermore, they neglect terms higher than second order (i.e. j > 2). In doing so, they predict equal values for the effective gravity at the location facing the companion and on the opposite side (see their Fig. 2). In contrast, we find that tidal deformation at the surface closer to the companion is larger, giving a lower effective gravity here, because in our approach we take the higher-order terms into account.
3. Results
In the next section, we present the mass loss rate from the donor calculated using the standard Roche lobe formalism (Eq. (2)), and in Sect. 3.2 we analyse the structural response of the stellar components due to the mass exchange. The impact of tides and rotation on the structure of the so-called “distorted models” is also discussed. In Sect. 3.3, we examine to what extent this evolution remains conservative, while in Sect. 3.4 the effects of asynchronism and eccentricity on the Roche lobe radius and mass loss rate are investigated.
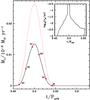 |
Fig. 1 Mass loss rate, Ṁ1, during the first periastron passage
as a function of time since apastron, in units of Porb
when the effects of tides and rotation on the donor’s structure are ignored (black,
solid curve) or included (red, dotted curve). The red squares labelled (a) to (f) on
the black curve indicate different moments in time, and correspond to the panels
labelled (a) to (f) in Figs. 2 and 6. The inset shows the evolution of the timescale
over which the mass transfer rate changes, |
3.1. Mass transfer rates
As we can see from Fig. 1, RLOF commences just before periastron, and ceases just after, with a maximum mass transfer rate at closest approach of Ṁ1 ≈ 1.3 × 10⁻⁵M⊙ yr-1 for the non-distorted model. Moving towards periastron, the donor’s Roche lobe radius shrinks as the separation between the two stars decreases (Eq. (2)). The amount that the donor star overfills its critical Roche surface (hereafter termed the overfilling factor) consequently rises, and Ṁ1 increases (Eqs. (7) and (12)). After reaching a maximum at periastron, both the degree of RLOF and Ṁ1 decline. This produces a Gaussian-like shape in the time evolution of Ṁ1, where the duration of RLOF is approximately 11 per cent of the orbital period.
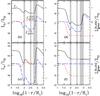 |
Fig. 2 Stellar luminosity profile, Lr (black
solid curve, left axis), and contributions from the homologous,
|
For the distorted model, Ṁ1 (at a given phase) is higher than for the non-distorted case (dashed, red curve in Fig. 1), and at periastron peaks at approximately 2.6 × 10⁻⁵ M⊙ yr-1. The reason stems from the fact that the combined effects of tides and rotation reduce the effective surface gravity ⟨ g ⟩, increasing the donor’s radius (a relative increase of about 0.4 per cent compared to the non-distorted model), and thus the overfilling factor at any orbital phase. The effect of increased stellar radius has also been reported within the SPH simulations of LS11 and Renvoizé et al. (2002; see also Uryu & Eriguchi 1999, who use a different computational technique). The small increase in the donor’s radius has a significant impact on Ṁ1 due to its sensitivity on the overfilling factor, but marginally affects the duration of mass transfer, increasing it to about 12 per cent.
Such a modulation of the mass transfer rate with orbital phase was suggested to account for a change in the speed of the bipolar outflows emanating from the accretor of HD 44179 within the Red Rectangle. In this paradigm, the velocity of the ejected material is maximum at periastron, and minimum at apastron (Witt et al. 2009). Furthermore, variations of the X-ray luminosity of the intermediate-mass black hole HLX-1 (Lasota et al. 2011) and of the optical and ultra-violet luminosity of the symbiotic system BX Mon (Leibowitz et al. 2011) have also been attributed to such a modulation of the mass transfer rate.
3.2. Reaction of the stars
In contrast to circular orbits, mass transfer occurs periodically during each periastron passage, and changes with the orbital phase (Fig. 1), which gives rise to a corresponding short-term variability of the radius and luminosity of each star. The response of the donor and accretor during mass transfer is discussed in Sects. 3.2.1 and 3.2.2, respectively.
3.2.1. The donor star
In accordance with e.g. Webbink (1977a) and Neo
et al. (1977), the action of removing mass from
radiative layers (where the entropy gradient is positive) absorbs energy
( ; see blue, short-dashed
curves in Fig. 2). Conversely, in the
super-adiabatic region (right-most shaded area in Fig. 2) mass loss causes a slight increase in
Lr because in those layers
; see blue, short-dashed
curves in Fig. 2). Conversely, in the
super-adiabatic region (right-most shaded area in Fig. 2) mass loss causes a slight increase in
Lr because in those layers
 .
.
As discussed in Webbink (1976), a changing mass
transfer rate will perturb the thermal structure of the star over a timescale
 .
Initially, τṀ is so short (inset of Fig.
1) that only the outermost surface layers, which
consist of the surface convection zone, can restore thermal equilibrium on a timescale
τth ≪ τṀ. In
these super-adiabatic layers (which encompass about 3 per cent of the donor radius at
point (b)),
.
Initially, τṀ is so short (inset of Fig.
1) that only the outermost surface layers, which
consist of the surface convection zone, can restore thermal equilibrium on a timescale
τth ≪ τṀ. In
these super-adiabatic layers (which encompass about 3 per cent of the donor radius at
point (b)),  and the luminosity increases
due to the dominant contribution from
and the luminosity increases
due to the dominant contribution from  (panel (b), Fig. 2).
Subsequently, as Ṁ1 increases towards periastron, an
ever-growing deficit in  within the radiative layers
develops. In parallel, as τṀ is also
increasing, the condition
τth < τṀ
moves deeper (encompassing about 10 per cent of the donor’s radius at point (c)).
Because
dominates over a larger fraction of the radiative envelope, the luminosity deficit grows
in these layers (black curves in Fig. 2) and
entails an over-all reduction of the star’s surface luminosity
L1 (e.g. point (c), left panel of Fig. 3) and radius R1 (left
panel, point (c) on black curve of Fig. 4), as
attested by
within the radiative layers
develops. In parallel, as τṀ is also
increasing, the condition
τth < τṀ
moves deeper (encompassing about 10 per cent of the donor’s radius at point (c)).
Because
dominates over a larger fraction of the radiative envelope, the luminosity deficit grows
in these layers (black curves in Fig. 2) and
entails an over-all reduction of the star’s surface luminosity
L1 (e.g. point (c), left panel of Fig. 3) and radius R1 (left
panel, point (c) on black curve of Fig. 4), as
attested by  (red long-dashed curves,
panels (b) and (c) in Fig. 2).
(red long-dashed curves,
panels (b) and (c) in Fig. 2).
Away from periastron, both  and
τṀ decline. The former will still cause
R1 and L1 to shrink (Figs.
3 and 4,
e.g. point (d)) but at a slower rate. The latter will give rise to a decrease in
due to decompression of the deep radiative layers where
τṀ < τth,
and eventually
becomes negative (panel (d) of Fig. 2). Once mass
loss shuts off, the radiative layers expand as energy flows from the interior to fill
the luminosity deficit and restore thermal equilibrium (Fig. 2, panel (f)), causing a corresponding rise in
L1 and R1 (e.g. point (f) in
Figs. 3 and 4).
and
τṀ decline. The former will still cause
R1 and L1 to shrink (Figs.
3 and 4,
e.g. point (d)) but at a slower rate. The latter will give rise to a decrease in
due to decompression of the deep radiative layers where
τṀ < τth,
and eventually
becomes negative (panel (d) of Fig. 2). Once mass
loss shuts off, the radiative layers expand as energy flows from the interior to fill
the luminosity deficit and restore thermal equilibrium (Fig. 2, panel (f)), causing a corresponding rise in
L1 and R1 (e.g. point (f) in
Figs. 3 and 4).
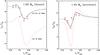 |
Fig. 3 Evolution of the surface luminosity for the donor, L1 (left panel), and of the accretor, L2 (right panel) during mass transfer at the first periastron passage. The meaning of the lines are the same as for Fig. 1. Points labelled (a) to (f) correspond to the points labelled (a) to (f) in Fig. 1. |
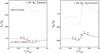 |
Fig. 4 Similar to Fig. 3, but now depicting the evolution of the radius for the donor R1 (left panel) and the accretor R2 (right panel) during the first periastron passage. |
By the time the donor starts overfilling its Roche lobe at the second periastron passage, the star has not yet fully recovered thermal equilibrium and R1 and L1 are slightly smaller than at the beginning of the simulation. Subsequent mass transfer episodes perturb the structure further, and R1 and L1 become ever smaller at each new mass transfer episode (black curve, Fig. 5). Despite the short-term reaction of the donor during periastron, the aforementioned longer-term behaviour is in accordance with studies of predominantly radiative stars in circular orbits (e.g. Webbink 1977a,b; Siess et al. 2013).
For the distorted model (red, dotted curves in Figs. 3 and 4), the donor is over-sized and under-luminous compared to the non-distorted model for all orbital phases. The evolution of R1 and L1 during the periastron passage are qualitatively the same as for the non-distorted model, but for two main differences. Firstly, before mass transfer starts, R1 rises while L1 declines. This is because, as the stellar separation shrinks, the surface gravity decreases due to the strengthening of the tidal interaction terms on the right hand side of Eq. (24). In turn, the stars’ structure will be less compact, and the reverse process occurs once the stellar separation increases. Secondly, the evolution of R1 and L1 during mass transfer is perturbed more significantly, due to the larger mass transfer rates obtained in the tidally distorted case, as discussed in Sect. 3.1.
3.2.2. The accreting star
As with the donor, the reaction of the accretor is initially dictated by the surface convection zone, but because the extent of that region is about twice that of the donor’s, it governs the reaction over a longer duration (almost until periastron, see panels (b) and (c) in Fig. 62). The response of the accretor is opposite to that of the donor star; mass addition to the convective layers causes the surface luminosity, L2, and radius, R2, to shrink (points (b) to (c) in right panels of Figs. 3 and 4).
As the stars move away from periastron, the compression decelerates as
τṀ declines, and
increases. The positive contribution of
due to the response of the radiative layers dominates (panel (d), Fig. 6), causing a rise in L2
and an expansion of the surface layers (e.g. point (d), Figs. 3 and 4).
At t ≥ 0.53Porb since apastron, mass
accretion has become negligible ( ) and contraction resumes
(; see panel (f), Fig. 6) as the excess energy originally created in the
radiative layers by the deposition of matter is now radiated away. Note that
) and contraction resumes
(; see panel (f), Fig. 6) as the excess energy originally created in the
radiative layers by the deposition of matter is now radiated away. Note that
 is
much smaller (panel (f)) because the accretor is no longer perturbed by mass deposition,
and is relaxing towards thermal equilibrium. Hence, L2 and
R2 decrease slightly (point (f) in Figs. 3 and 4).
Subsequent mass transfer episodes causes L2 and
R2 to gradually rise from orbit to orbit (red, dotted
curve in Fig. 5), again in accordance with studies
of accreting radiative stars in circular binaries (e.g. Neo et al. 1977; Webbink 1976).
is
much smaller (panel (f)) because the accretor is no longer perturbed by mass deposition,
and is relaxing towards thermal equilibrium. Hence, L2 and
R2 decrease slightly (point (f) in Figs. 3 and 4).
Subsequent mass transfer episodes causes L2 and
R2 to gradually rise from orbit to orbit (red, dotted
curve in Fig. 5), again in accordance with studies
of accreting radiative stars in circular binaries (e.g. Neo et al. 1977; Webbink 1976).
The impact of tides and rotation on the accretor is the same as for the donor, except that at t ≳ 0.52Porb, the distorted model has a somewhat higher luminosity than the non-distorted case. This is because the higher mass accretion rate creates a larger energy excess in the radiative layers below the surface convection zone due to compression.
For the non-distorted models, we find that, during the periastron passage, the surface luminosity of the donor decreases by as much as ΔL1 ≈ −1.3 L⊙, while for the accretor it increases by as much as ΔL2 ≈ 2 L⊙. However, these variations almost cancel out, and the net change in the luminosity for the entire system (ΔLΣ = ΔL1 + ΔL2) is ΔLΣ ≈ 0.7 L⊙. This corresponds to a variation of about 0.03 magnitude, which may not be easily observable. For the distorted models, on the other hand, we find ΔL1 ≈ −2.6 L⊙ and ΔL2 ≈ 6.5, and so a change of about 0.1 mag (ΔLΣ ≈ 3.9 L⊙), which detection may be more feasible. We emphasize, however, that despite the low values of ΔLΣ, the change in the intrinsic luminosities of each star is significant and takes place over a brief period of time (approximately 1−2 h in our model).
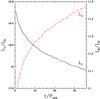 |
Fig. 5 Evolution of the surface luminosity of the donor L1 (solid black curve, left axis) and of the accretor L2 (dashed red curve, right axis) just before mass transfer recommences over a duration of about 30 periastron passages. |
3.3. Effect of direct impact accretion
For an accretion disc to form, the minimum distance of approach between the matter stream
and the accretor must satisfy ![Mathematical equation: \begin{equation} R_{\mathrm{min}}\approx 0.0425D[q(1+q)]^{1/4}>R_{2}, \label{R_min} \end{equation}](/articles/aa/full_html/2013/08/aa20391-12/aa20391-12-eq178.png) (28)(Ulrich &
Burger 1976). For our system,
Rmin ≈ 0.2 R⊙ < R2,
implying direct impact accretion and the formation of a hot-spot, in accord with LS11. The
presence of a hot-spot may give rise to mass ejection from the system. To investigate this
possibility, we follow van Rensbergen et al. (2008), and briefly summarise below their formalism that we implemented within
BINSTAR.
(28)(Ulrich &
Burger 1976). For our system,
Rmin ≈ 0.2 R⊙ < R2,
implying direct impact accretion and the formation of a hot-spot, in accord with LS11. The
presence of a hot-spot may give rise to mass ejection from the system. To investigate this
possibility, we follow van Rensbergen et al. (2008), and briefly summarise below their formalism that we implemented within
BINSTAR.
According to these authors, the hot-spot luminosity, LHS, is
given by  (29)where
Sacc is the fraction of the accretor’s surface inhabited by
the hot-spot and αacc is the accretion efficiency. A fit to
the variable K was performed by van Rensbergen et al. (2011) using an observed sample of 13 Algol binaries,
and is given by
(29)where
Sacc is the fraction of the accretor’s surface inhabited by
the hot-spot and αacc is the accretion efficiency. A fit to
the variable K was performed by van Rensbergen et al. (2011) using an observed sample of 13 Algol binaries,
and is given by  (30)The accretion
luminosity, Lacc, is calculated from the potential difference
between the ℒ1 point,
Ψ(xℒ1,0,0) and
the point of impact,
Ψimp(ximp,yimp,0)
(using Eq. (3)), yielding
(30)The accretion
luminosity, Lacc, is calculated from the potential difference
between the ℒ1 point,
Ψ(xℒ1,0,0) and
the point of impact,
Ψimp(ximp,yimp,0)
(using Eq. (3)), yielding  (31)The point of impact,
(ximp,yimp),
can be found from ballistic trajectory calculations. However, to do this for eccentric
systems where the separation, hence the potential, are varying with time, is beyond the
scope of the paper. To estimate
(ximp,yimp), we
use the angle between the point of impact and the line joining the two stars,
ϖ, determined from the ballistic trajectories calculated by Flannery
(1975) for different values of q
in circular orbits. For our system, we use ϖ ≈ 70°. From Eqs.
(29) and (31), it is obvious that LHS follows the
same orbital modulation as Ṁ1, and if
Ṁ1 exceeds some critical value
Ṁcrit, the luminosity in the hot-spot region may exceed the
Eddington value, LEdd, allowing for mass ejection. van
Rensbergen et al. (2008) give
(31)The point of impact,
(ximp,yimp),
can be found from ballistic trajectory calculations. However, to do this for eccentric
systems where the separation, hence the potential, are varying with time, is beyond the
scope of the paper. To estimate
(ximp,yimp), we
use the angle between the point of impact and the line joining the two stars,
ϖ, determined from the ballistic trajectories calculated by Flannery
(1975) for different values of q
in circular orbits. For our system, we use ϖ ≈ 70°. From Eqs.
(29) and (31), it is obvious that LHS follows the
same orbital modulation as Ṁ1, and if
Ṁ1 exceeds some critical value
Ṁcrit, the luminosity in the hot-spot region may exceed the
Eddington value, LEdd, allowing for mass ejection. van
Rensbergen et al. (2008) give ![Mathematical equation: \begin{eqnarray} \dot{M}_{\mathrm{crit}} &=& \frac{1}{\Psi_{\L1}-\Psi_{\mathrm{imp}}} \left\{\left[\frac{L_{\mathrm{Edd}}R_{2}}{GM_{2}}\left(\frac{GM_{1}}{r_{1,\mathrm{imp}}}+\frac{GM_{2}}{R_{2}}+\frac{1}{2}r_{\mathrm{C,imp}}^{2}\omega^{2} \right.\right.\right.\notag \\ &&\left.\left.\left.-\,\frac{1}{2}R_{2}^{2}\Omega^{2}_{2}\right) - L_{2}\right]\frac{1}{K}+\dot{E}_{\mathrm{rot}}\right\}, \label{M_crit} \end{eqnarray}](/articles/aa/full_html/2013/08/aa20391-12/aa20391-12-eq194.png) (32)where
r1,imp and
rC,imp are the distances from the point
of impact to the centre of mass of the donor and the binary system respectively and
Ėrot is the rate of change of the accretor’s rotational
kinetic energy. Due to the small amount of mass that is transferred (up to approximately
10-7 M⊙ in one orbit), the change in the
accretor’s spin speed is negligible over the timescale of the simulation, and
Ėrot ≈ 0.
(32)where
r1,imp and
rC,imp are the distances from the point
of impact to the centre of mass of the donor and the binary system respectively and
Ėrot is the rate of change of the accretor’s rotational
kinetic energy. Due to the small amount of mass that is transferred (up to approximately
10-7 M⊙ in one orbit), the change in the
accretor’s spin speed is negligible over the timescale of the simulation, and
Ėrot ≈ 0.

The temperature of the hot-spot, THS, can be estimated from
 , where
SHS ≈ 1020 cm2 is the area of the
hot-spot on our accretor’s surface (see Gunn et al. 1999; van Rensbergen et al. 2008). At
periastron, THS ≈ 105 K, so the material in that
region is fully ionized, justifying our use of the electron scattering opacity in the
expression for LEdd.
, where
SHS ≈ 1020 cm2 is the area of the
hot-spot on our accretor’s surface (see Gunn et al. 1999; van Rensbergen et al. 2008). At
periastron, THS ≈ 105 K, so the material in that
region is fully ionized, justifying our use of the electron scattering opacity in the
expression for LEdd.
3.4. Effects of asynchronism and eccentricity
Figure 7 shows the effects on Ṁ1 of an eccentric orbit and an asynchronously rotating donor on the Roche lobe radius3 (Eqs. (3) and (4)). Three cases are considered: sub-synchronous rotation of the donor with the orbital motion at periastron, f = 0.90 (red, dotted curves), synchronous rotation (f = 1.00, green, short-dashed curves) and super-synchronous rotation (f = 1.02, blue, long-dashed curves).
For the non-distorted models, at a given orbital phase, increasing the value of f increases Ṁ1. At periastron, for example, Ṁ1 rises from approximately 7.0 × 10⁻⁶ M⊙ yr-1 for the sub-synchronous case to about 9.6 × 10⁻⁵ M⊙ yr-1 for the super-synchronous case; about a factor of 14 increase. The explanation resides in the fact that a higher value of f yields a smaller Roche lobe radius. In turn, the donor will over-fill its Roche lobe further (i.e. an increase in (R1 − Rℒ1)/R1 with increasing f; see top panel of Fig. 8), which will cause the mass transfer rate to grow (Eqs. (7) and (12)). Despite the enhanced mass loss rate, we find that mass transfer is still fully conservative. Values of Ṁcrit are higher than Ṁ1 at periastron by about a factor of 100 for the sub-synchronous case to about a factor of 6 for the super-synchronous case.
On the other hand, for the tidally and rotationally distorted models, the mass transfer rate at periastron is typically a factor of 10 higher than for the non-distorted configuration, for a given value of f. This increase in Ṁ1 leads to both a higher hot-spot luminosity (as high as about 105L⊙ at periastron for the distorted, super-synchronous case) and non-conservative evolution for the synchronous and super-synchronous models (top panel, Fig. 9), with values of Ṁcrit of 7 × 10⁻⁴M⊙ yr-1 and 6 × 10⁻⁴M⊙ yr-1, respectively. The accretion efficiency β at a given phase is smaller for the super-synchronous case, because for this model Ṁ1 is higher, and so it further exceeds Ṁcrit leading to more mass ejection. Due to the modulation of Ṁ1 with orbital phase, β is a minimum at periastron. During one orbit, the total ejected mass from the accretor is about 10-9M⊙ and 2 × 10⁻⁸M⊙ for the synchronous and super-synchronous models, respectively (bottom panel, Fig. 9).
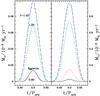 |
Fig. 7 Left panel, left axis: similar to Fig. 1, but here the effects of asynchronism and eccentricity on the Roche lobe radius are taken into account (Eqs. (3) and (4)). Black, solid curve: standard Roche lobe formalism; red, dotted curve: f = 0.90; green, short-dashed curve: f = 1.00; blue, long-dashed curve: f = 1.02. Right panel, right axis: the same but for the distorted models. |
The change in the Roche lobe radius with f can be explained in terms of
the location of the ℒ1 point. Recall that ℒ1 is where
∂Ψ/∂x = 0, i.e. where a particle
experiences no net acceleration, due to the balance of the centrifugal and gravitational
accelerations. Let the position of the ℒ1 point at a given phase for a given
value of f be xℒ1(0). If
f is then increased (causing a corresponding increase in
),
then a test particle at xℒ1(0) will experience a
stronger centrifugal acceleration, hence an outward displacement. The new location of
xℒ1 therefore needs to be situated closer to the
donor star
[xℒ1 < xℒ1(0)]
to re-establish a net zero-acceleration. Since the Roche equipotential surface passes
through the ℒ1 point, a decreasing value of
xℒ1 means that both the volume and the radius
of the Roche lobe will shrink.
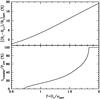 |
Fig. 8 Relative difference between the donor radius and its Roche lobe radius at periastron, [(R1 − Rℒ1)/R1] peri (top panel), and the duration of mass transfer, ttransfer, in units of the orbital period (bottom panel), as a function of f for our 1.50 M⊙ donor. |
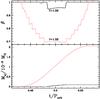 |
Fig. 9 Top panel: accretion efficiency, β = |Ṁ2/Ṁ1 | versus time for the distorted models, where Rℒ1 is determined from Eqs. (3) and (4), with f = 1.00 (black, solid curve) and f = 1.02 (red, dotted curve). Bottom panel: mass of ejected material, Mej (in units of 10-8M⊙), as a function of time. |
A shrinking Roche lobe radius with rising f also means that mass transfer will occur for a longer duration, because mass transfer will start (end) earlier (later) in the orbit. This duration, ttransfer, is shown in the bottom panel of Fig. 8. For our super-synchronous case, mass transfer lasts for approximately 17 per cent of the orbital period.
We also see that if f ≲ 0.7, mass transfer does not occur at all. This is because the Roche lobe radius of the super-synchronously rotating donor increases so much, compared to the value obtained from Eq. (2), that the donor star never fills it. Indeed, as Fig. 8 shows, (R1 − Rℒ1)/R1 < 0 at periastron for f ≲ 0.7. Therefore, if we evolve our 1.50+1.40 M⊙ system with f = 0.36, our system will never undergo mass transfer, in contrast with LS11. At periastron, for f = 0.36, the relative increase in the Roche lobe radius due to asynchronous rotation, compared to the value obtained from Eq. (2), is approximately 6 per cent, in agreement with Sepinsky et al. (2007a). We return to the comparison of our work with that of LS11 in Sect. 4. On the other hand, for f ≳ 1.8, Fig. 8 shows that mass transfer will occur over the whole orbit, since at all phases Rℒ1 < R1.
Finally, the change in
with orbital phase, will cause a corresponding change in the donor’s Roche lobe radius. To
understand this more clearly, we can recast Eq. (4) in terms of the instantaneous ratio of the spin angular speed of the donor
star, and the orbital angular velocity, i.e.  (33)As we move from
periastron to apastron, the orbital speed decreases. Therefore, for a given value of
Ω1, the donor star will rotate progressively more super-synchronously with
the orbital motion, causing a corresponding rise in both
,
and the centrifugal acceleration. Consequently, the Roche lobe radius will be
progressively smaller than the value calculated by the standard Eggleton (1983) formalism, as apastron is approached.
(33)As we move from
periastron to apastron, the orbital speed decreases. Therefore, for a given value of
Ω1, the donor star will rotate progressively more super-synchronously with
the orbital motion, causing a corresponding rise in both
,
and the centrifugal acceleration. Consequently, the Roche lobe radius will be
progressively smaller than the value calculated by the standard Eggleton (1983) formalism, as apastron is approached.
4. Discussion
The evolution of the mass transfer rate has a Gaussian-like behaviour, with a maximum value occurring at periastron, in excellent agreement with the findings of LS11. However, we also report major differences.
LS11 obtain a maximum mass transfer rate which occurs in fact slightly after periastron. This delay is due to the time required by the material ejected from the donor to fall down the potential well of the companion star and be accreted. This is approximately the free-fall time, of the order of τff ≈ 0.06Porb (LS11). In BINSTAR, this delay is absent because the code does not currently follow the ballistic trajectory of the ejected material. Instead, it assumes that mass transfer occurs instantaneously. The delay found by LS11 is more physical as a result of their more realistic treatment of mass transfer, but it does not change the overall picture.
Furthermore, we emphasize that our determination of the point of impact on the accretor’s surface based on the angle ϖ is rather crude. Sepinsky et al. (2010) calculated ballistic trajectories in eccentric binaries for a single particle ejected at periastron. They found that the particle may fall back onto the donor star, as well as fall onto the accretor via a disc or direct impact. However, as discussed below, mass transfer occurs over a significant fraction of the orbital period, and not just at periastron. Furthermore, their study neglects the contribution of the thermal sound speed at the ℒ1 point to the ejected particle’s velocity. It is unclear how these modifications would impact on the ballistic trajectory and on the mass transfer.
If we take the effects of asynchronous rotation of the donor (with f ≈ 0.36) and the eccentricity of the orbit on the Roche lobe radius into account, our donor never fills its Roche lobe, even if the effect of tides, which act to increase the donor radius, are considered. This is in contrast to LS11, who find that mass transfer lasts for approximately 25 per cent of the orbital period, and peaks at periastron at a value of Ṁ1 ≈ 2 × 10⁻³ M⊙ yr-1. In their simulation, tidal and rotational forces increase the radius of their donor to a greater extent, to approximately 1.8 R⊙, so that the donor is sufficiently large to fill its Roche lobe near periastron. As a check, we re-ran a simulation using a slightly more evolved donor star with R1 ≈ 1.8 R⊙, again accounting for the effects of asynchronism and eccentricity on the value of Rℒ1. Now, we find that mass transfer lasts for about 30 per cent of the orbital period, in good agreement with LS11, but our peak mass transfer rate is approximately a factor of 35 larger than theirs. This may arise from the uncertainty in R1, since LS11 cannot provide a precise value. Even though this uncertainty is small, it may greatly impact upon Ṁ1 due to the sensitivity on the degree of overflow (Eqs. (7) and (12)).
The technique employed by LS11 to determine mass transfer rates is obviously more physically realistic than the 1-dimensional analytical scheme used in the present study. The assumptions underlying Eqs. (7) and (12) that the flow is laminar, and that material moves along the equipotential surfaces is not strictly valid. Instead, material flows upwards from within the Roche lobe of the donor, rather than along its surface (Eggleton 2006), which would have the effect of increasing the mass transfer rate. On the other hand, the pressure gradients will produce turbulence in the flow rather than bulk motion of the material, and will contribute to reduce the mass transfer rate. Ge et al. (2010), who use a similar formalism to Eq. (12), estimate that the calculated mass transfer rate is accurate to within about a factor of 2.
Despite the fact that LS11 distribute their SPH particles according to density profiles
calculated from their stellar evolution code, they do not consider the transport of energy
due to convection and radiation, (similarly to SPH simulations by Regős et al. 2005; and Church et al. 2009). Instead, LS11 apply a simple polytropic equation of state of the form
 (34)where
u is the specific internal energy of the stellar material, and
γ = 5/3. While a value of
γ = 5/3 is a reasonable approximation for the deep
optically thick layers of the interior, it is inadequate to treat the regions of partial
ionization or small optical thickness. Considering that the layers of the star in LS11 are
adiabatic, their SPH simulations will over-estimate the pressure and the temperature in
these layers, yielding larger radii. This ‘relaxed’ SPH stellar configuration will be able
to expand to a greater extent due to tidal and rotational deformation, and impact on the
mass transfer rate.
(34)where
u is the specific internal energy of the stellar material, and
γ = 5/3. While a value of
γ = 5/3 is a reasonable approximation for the deep
optically thick layers of the interior, it is inadequate to treat the regions of partial
ionization or small optical thickness. Considering that the layers of the star in LS11 are
adiabatic, their SPH simulations will over-estimate the pressure and the temperature in
these layers, yielding larger radii. This ‘relaxed’ SPH stellar configuration will be able
to expand to a greater extent due to tidal and rotational deformation, and impact on the
mass transfer rate.
Even though our simulations are able to provide a more realistic internal structure, the treatment of tides and rotation outlined in Sect. 2.5 remains an approximation, since all 3-dimensional effects are folded into a 1-dimensional formalism (see also Knigge et al. 2011, for a discussion of this matter). It is therefore unclear whether the discrepancy in stellar radii, and therefore the mass transfer rate, is due to the polytropic approximation used by LS11 or the subtleties of the KT70 method used here.
For our distorted, super-synchronous model, which gives a similar mass transfer rate at periastron as found by LS11, mass transfer is non-conservative. Over one orbit, the total mass lost by the donor is approximately 1 × 10⁻⁷M⊙, while the total accreted mass is about 8 × 10⁻⁸ M⊙, i.e. 20 per cent of the transferred material is ejected by the accretor. However, in contrast to SPH simulations, we cannot follow the ultimate fate of this material. For their 1.50+1.40 M⊙ system, 20 per cent of the transferred material formed an envelope around the system, while 5 per cent was ejected. On the other hand, since LS11 do not model the thermal structure of the hot-spot, they may under-estimate the fraction of material that is ejected from the system.
It is evident from Figs. 7 and 8 that the degree of asynchronism of the donor star has a significant impact on both the mass loss rate and the duration of mass transfer. It should be pointed out that the mass transfer rates predicted by the standard Eggleton (1983) formalism (which assumes that the star is rotating synchronously with the orbit at each location) and the f = 1.00 case with non-zero eccentricity differ by approximately a factor of about 5 for the non-distorted models. This factor is further enhanced to about 60 due to tidal and rotational effects on the donor star. Hence, it is imperative that the effect of eccentricity and asynchronism on the Roche lobe geometry, and the distortion of the donor star, be accounted for.
In the Sepinsky et al. (2007b; 2009) studies, the structure and the response of the donor star were not taken into account, and mass transfer was modelled as a delta function at periastron. This is in contrast with Lajoie & Sills (2011a), LS11 and the present work which show that the episode of mass exchange represents a non-negligible fraction of the orbital period. Allowing for non-instantaneous mass transfer may impact on the evolution of the binary system in a way that is different to the delta function model.
5. Summary
This study paves the first steps towards calculating mass transfer rates for significantly eccentric binaries, taking the effects of tides and rotation on the structures of the stellar components into account, as well as the effects of eccentricity and asychronous rotation of the donor on the Roche lobe radius. In this paper, we have used a state-of-the-art binary evolution code BINSTAR to calculate mass transfer rates for a 1.50+1.40 M⊙ main sequence binary system, with an eccentricity of 0.25 and an orbital period of Porb ≈ 0.7d and we compared our results with the SPH calculations performed by LS11 for the same system.
The evolution of the mass transfer rate with time shows Gaussian-like behaviour, with a maximum mass transfer rate occurring at periastron, in qualitative agreement with LS11. The accretion luminosity (which emanates from a hotspot for this particular system) also varies in response to the changing mass transfer rate. The duration of the mass transfer rate represents a non-negligible fraction of the orbital period, particularly if the donor star is rotating sufficiently rapidly. On the other hand, mass transfer may not occur at all if the donor is rotating too slowly.
During RLOF, the timescale over which the mass transfer rate changes,
is so
short that only the outer-most stellar layers, consisting of the surface convection zone,
can restore thermal equilibrium. Initially, the response of each star is dictated by this
convection zone. As mass transfer proceeds, a larger fraction of the stars’ envelope,
consisting of the radiative layers, dictate the subsequent response of each star.
The evolution of the luminosity of the donor and accretor over 30 orbits (Fig. 5) highlights the fact that the longer-term evolution of the stellar structure is what we would expect for stars with significantly radiative envelopes, as shown by studies of such stars in circular orbits.
Finally, tidal and rotational forces increase the surface radius of the donor, enhancing mass transfer further by a factor of about 10, potentially leading to non-conservative mass transfer.
In the future, we wish to follow the mass transfer rate as a function of orbital phase over many orbits, and determine the secular orbital evolution of eccentric binaries.
For the accretor, the convection zones due to ionized hydrogen and the first ionization of helium are merged into a single zone.
The values of and
may
seem high compared to the surface luminosity but what is physically relevant is the sum of
these two contributions which, as previously stated, is not affected by the choice of
faccr.
The step-like features near periastron, particularly evident for the synchronous and super-synchronous models, are a result of low spatial resolution in the surface layers of the donor star, revealed by the small time-steps used. This produces the corresponding features in Fig. 9.
Acknowledgments
P.J.D. acknowledges financial support from the Communauté Française de Belgique – Actions de recherche Concertées, from the Université Libre de Bruxelles and from an FNRS Fellowship. P.J.D. would also like to thank U. Kolb and J. Sepinsky for many useful discussions, and A. Sills for providing further details of the stellar models used in the SPH simulations. We also thank S. Toupin for his assistance with the development of the BINSTAR routines which calculates the Roche lobe radius, and the distortion of the star due to tides and rotation. Finally, we are grateful to the anonymous referee whose constructive comments improved the quality of the manuscript. L.S. is a FNRS research associate.
References
- Braun, H., & Langer, N. 1995, A&A, 297, 483 [NASA ADS] [Google Scholar]
- Church, R. P., Dischler, J., Davies, M. B., et al. 2009, MNRAS, 395, 1127 [NASA ADS] [CrossRef] [Google Scholar]
- D’Antona, F., Mazzitelli, I., & Ritter, H. 1989, A&A, 225, 391 [NASA ADS] [Google Scholar]
- Deloye, C. J., Taam, R. E., Winisdoeffer, C., & Chabrier, G. 2007, MNRAS, 381, 525 [NASA ADS] [CrossRef] [Google Scholar]
- Edwards, D. A., & Pringle, J. E. 1987, MNRAS, 229, 383 [NASA ADS] [CrossRef] [Google Scholar]
- Eggleton, P. P. 1983, ApJ, 268, 368 [NASA ADS] [CrossRef] [Google Scholar]
- Eggleton, P. P. 2006, Evolutionary Processes in Binary and Multiple Stars, ed. P. Eggleton (Cambridge, UK: Cambridge University Press) [Google Scholar]
- Endal, A. S., & Sofia, S. 1976, ApJ, 210, 184 [NASA ADS] [CrossRef] [Google Scholar]
- Flannery, B. P. 1975, MNRAS, 170, 325 [NASA ADS] [CrossRef] [Google Scholar]
- Fujimoto, M. Y., & Iben, I. Jr. 1989, ApJ, 341, 306 [NASA ADS] [CrossRef] [Google Scholar]
- Ge, H., Hjellming, M. S., Webbink, R. F., Chen, X., & Han, Z. 2010, ApJ, 717, 724 [NASA ADS] [CrossRef] [Google Scholar]
- Guenther, D. B., Demarque, P., Kim, Y.-C., & Pinsonneault, M. H. 1992, ApJ, 387, 372 [NASA ADS] [CrossRef] [Google Scholar]
- Gunn, A. G., Brady, P. A., Migenes, V., Spencer, R. E., & Doyle, J. G. 1999, MNRAS, 304, 611 [NASA ADS] [CrossRef] [Google Scholar]
- Jorissen, A., Frankowski, A., Famaey, B., & Van Eck, S. 2009, A&A, 498, 489 [NASA ADS] [CrossRef] [EDP Sciences] [Google Scholar]
- Kippenhahn, R., & Meyer-Hofmeister, E. 1977, A&A, 54, 539 [NASA ADS] [Google Scholar]
- Kippenhahn, R., & Thomas, H.-C. 1970, in Stellar Rotation, ed. A. Slettebak (Holland: D. Reidel Publ. Co. Dordrecht), 20 (KT90) [Google Scholar]
- Knigge, C., Baraffe, I., & Patterson, J. 2011, ApJS, 194, 28 [NASA ADS] [CrossRef] [Google Scholar]
- Kolb, U., & Ritter, H. 1990, A&A, 236, 385 [NASA ADS] [Google Scholar]
- Kopal, Z. 1959, in Close Binary Systems (London, UK: Chapman & Hall) [Google Scholar]
- Lajoie, C.-P., & Sills, A. 2011a, ApJ, 726, 66 [Google Scholar]
- Lajoie, C.-P., & Sills, A. 2011b, ApJ, 726, 67, LS11 [NASA ADS] [CrossRef] [Google Scholar]
- Landin, N. R., Mendes, L. T. S., & Vaz, L. P. R. 2009, A&A, 494, 209 [NASA ADS] [CrossRef] [EDP Sciences] [Google Scholar]
- Lasota, J.-P., Alexander, T., Dubus, G., et al. 2011, ApJ, 735, 89 [NASA ADS] [CrossRef] [Google Scholar]
- Leibowitz, E. M., & Formiggini, L. 2011, MNRAS, 414, 2406 [NASA ADS] [CrossRef] [Google Scholar]
- Limber, D. N. 1963, ApJ, 138, 1112 [NASA ADS] [CrossRef] [Google Scholar]
- Neo, S., Miyaji, S., Nomoto, K., & Sugimoto, D. 1977, PASJ, 29, 249 [NASA ADS] [Google Scholar]
- Nicholls, C. P., & Wood, P. R. 2012, MNRAS, 421, 2616 [NASA ADS] [CrossRef] [MathSciNet] [Google Scholar]
- Paczyński, B. 1976, in Structure and Evolution of Close Binary Systems, eds. P. Eggleton, S. Mitton, & J. Whelan, IAU Symp., 73, 75 [Google Scholar]
- Petrova, A. V., & Orlov, V. V. 1999, AJ, 117, 587 [NASA ADS] [CrossRef] [Google Scholar]
- Press, W. H., Teukolsky, S. A., Vetterling, W. T., & Flannery, B. P. 1992, Numerical Recipes in Fortran. The art of scientific computing, 2nd edn. (Cambridge: Cambridge University Press) [Google Scholar]
- Pringle, J. E., & Wade, R. A. 1985, in Interacting Binary Stars, eds. J. E. Pringle, & R. A. Wade, 123 [Google Scholar]
- Regős, E., Bailey, V. C., & Mardling, R. 2005, MNRAS, 358, 544 [NASA ADS] [CrossRef] [Google Scholar]
- Renvoizé, V., Baraffe, I., Kolb, U., & Ritter, H. 2002, A&A, 389, 485 [NASA ADS] [CrossRef] [EDP Sciences] [Google Scholar]
- Ritter, H. 1988, A&A, 202, 93 [NASA ADS] [Google Scholar]
- Savonije, G. J. 1978, A&A, 62, 317 [NASA ADS] [Google Scholar]
- Sepinsky, J. F., Willems, B., & Kalogera, V. 2007a, ApJ, 660, 1624 [NASA ADS] [CrossRef] [Google Scholar]
- Sepinsky, J. F., Willems, B., Kalogera, V., & Rasio, F. A. 2007b, ApJ, 667, 1170 [NASA ADS] [CrossRef] [Google Scholar]
- Sepinsky, J. F., Willems, B., Kalogera, V. & Rasio, F. A. 2009, ApJ, 702, 1387 [NASA ADS] [CrossRef] [Google Scholar]
- Sepinsky, J. F., Willems, B., Kalogera, V., & Rasio, F. A. 2010, ApJ, 724, 546 [NASA ADS] [CrossRef] [Google Scholar]
- Siess, L. 2006, A&A, 448, 717 [NASA ADS] [CrossRef] [EDP Sciences] [Google Scholar]
- Siess, L. 2007, A&A, 476, 893 [NASA ADS] [CrossRef] [EDP Sciences] [Google Scholar]
- Siess, L. 2009, A&A, 497, 463 [NASA ADS] [CrossRef] [EDP Sciences] [Google Scholar]
- Siess, L. 2010, A&A, 512, A10 [NASA ADS] [CrossRef] [EDP Sciences] [Google Scholar]
- Siess, L., Forestini, M., & Bertout, C. 1997, A&A, 326, 1001 [NASA ADS] [Google Scholar]
- Siess, L., Dufour, E., & Forestini, M. 2000, A&A, 358, 593 [NASA ADS] [Google Scholar]
- Siess, L., Izzard, R. G., Davis, P. J., & Deschamps, R. 2013, A&A, 550, A100 [NASA ADS] [CrossRef] [EDP Sciences] [Google Scholar]
- Song, H. F., Zhong, Z., & Lu, Y. 2009, A&A, 504, 161 [NASA ADS] [CrossRef] [EDP Sciences] [Google Scholar]
- Tout, C. A., Livio, M., & Bonnell, I. A. 1999, MNRAS, 310, 360 [NASA ADS] [CrossRef] [Google Scholar]
- Ulrich, R. K., & Burger, H. L. 1976, ApJ, 206, 509 [NASA ADS] [CrossRef] [Google Scholar]
- Uryu, K., & Eriguchi, Y. 1999, MNRAS, 303, 329 [NASA ADS] [CrossRef] [Google Scholar]
- van Rensbergen, W., De Greve, J.-P., De Loore, C., & Mennekens, N. 2008, A&A, 487, 1129 [NASA ADS] [CrossRef] [EDP Sciences] [Google Scholar]
- van Rensbergen, W., De Greve, J.-P., Mennekens, N., Jansen, K., & De Loore, C. 2011, A&A, 528, A16 [NASA ADS] [CrossRef] [EDP Sciences] [Google Scholar]
- Wang, B., & Han, Z. 2012, New Astron. Rev., 56, 122 [NASA ADS] [CrossRef] [Google Scholar]
- Warner, B. 1995, in Cataclysmic Variable Stars (Cambridge: Cambridge University Press), 28 [Google Scholar]
- Webbink, R. F. 1976, ApJS, 32, 583 [NASA ADS] [CrossRef] [Google Scholar]
- Webbink, R. F. 1977a, ApJ, 211, 486 [NASA ADS] [CrossRef] [Google Scholar]
- Webbink, R. F. 1977b, ApJ, 211, 881 [NASA ADS] [CrossRef] [Google Scholar]
- Willems, B., & Kolb, U. 2004, A&A, 419, 1057 [NASA ADS] [CrossRef] [EDP Sciences] [Google Scholar]
- Witt, A. N., Vijh, U. P., Hobbs, L. M., et al. 2009, ApJ, 693, 1946 [NASA ADS] [CrossRef] [Google Scholar]
- Zahn, J.-P. 1977, A&A, 57, 383 [NASA ADS] [Google Scholar]
Appendix A: Determining the Function F∗(q,
)
In the following description, we use a coordinate system where the origin lies at the centre of mass of the donor. The positive x-axis points from the centre of mass of the donor to the centre of mass of the accretor, while the z-axis is perpendicular to the orbital plane, and is parallel to the donor’s spin angular velocity. The y-axis lies on the orbital plane, and forms a right-handed set.
We start with Eq. (20) of Sepinsky et al. (2007a),
which gives the potential, Ψ (normalized by the potential due to the accretor,
 )
)
![Mathematical equation: \appendix \setcounter{section}{1} \begin{eqnarray} \Psi&=&-\frac{q}{(x^{2}+y^{2}+z^{2})^{\frac{1}{2}}}-\frac{1}{[(x-1)^{2}+y^{2}+z^{2}]^{\frac{1}{2}}} \nonumber \\ &&-\,\frac{1}{2}\mathcal{A}(1+q)(x^{2}+y^{2})+x, \label{Psi_app} \end{eqnarray}](/articles/aa/full_html/2013/08/aa20391-12/aa20391-12-eq246.png) (A.1)where
all coordinates are given in units of the instantaneous separation, D and
is given by Eq. (4). Following Meyer
& Meyer-Hofmeister (1983) and Ritter (1988), we can express the change in the
potential around the vicinity of the ℒ1 point, ΔΨ, using a Taylor expansion to
the second order, according to
(A.1)where
all coordinates are given in units of the instantaneous separation, D and
is given by Eq. (4). Following Meyer
& Meyer-Hofmeister (1983) and Ritter (1988), we can express the change in the
potential around the vicinity of the ℒ1 point, ΔΨ, using a Taylor expansion to
the second order, according to  (A.2)where
 ![Mathematical equation: \appendix \setcounter{section}{1} \begin{equation} B=\frac{1}{2}\left(\frac{\partial^{2}\Psi}{\partial y^{2}}\right)_{\mathcal{L}_{1}}=\frac{1}{2}[g(q)-\mathcal{A}-q\mathcal{A}], \label{ddpsi_dyy} \end{equation}](/articles/aa/full_html/2013/08/aa20391-12/aa20391-12-eq249.png) (A.3)where the subscript
ℒ1 indicates that the derivative is evaluated at the inner-Lagrangian point,
and g(q) is given by Eq. (10). Similarly,
(A.3)where the subscript
ℒ1 indicates that the derivative is evaluated at the inner-Lagrangian point,
and g(q) is given by Eq. (10). Similarly,  (A.4)Recalling that the
potential has been expressed in units of the secondary’s gravitational potential, and that
the distances are in units of the separation, then converting back to ‘normal’ units gives
us for B and C, respectively,
(A.4)Recalling that the
potential has been expressed in units of the secondary’s gravitational potential, and that
the distances are in units of the separation, then converting back to ‘normal’ units gives
us for B and C, respectively, ![Mathematical equation: \appendix \setcounter{section}{1} \begin{eqnarray} B & = & \frac{GM_{2}}{2D^3}[g(q)-\mathcal{A}-q\mathcal{A}] \nonumber \\ & = & \frac{GM_{1}}{2qD^3}[g(q)-\mathcal{A}-q\mathcal{A}], \label{B_2} \\ C & = &\frac{GM_{1}}{2qD^3}g(q). \label{C_2} \end{eqnarray}](/articles/aa/full_html/2013/08/aa20391-12/aa20391-12-eq253.png) We
can see from Eq. (A.2) that the
equipotential surface in the plane of the ℒ1 point is an ellipse with an area,
S, given by
We
can see from Eq. (A.2) that the
equipotential surface in the plane of the ℒ1 point is an ellipse with an area,
S, given by  (A.7)Following Meyer &
Meyer-Hofmeister (1983), the area of the cross section of the flow, Q, is
then
(A.7)Following Meyer &
Meyer-Hofmeister (1983), the area of the cross section of the flow, Q, is
then ![Mathematical equation: \appendix \setcounter{section}{1} \begin{equation} Q=\pi\frac{\mathcal{R}T_{\mathrm{eff,1}}}{\mu_{\mathrm{ph,1}}}\frac{1}{\sqrt{BC}}=\frac{2\pi\mathcal{R}T_{\mathrm{eff,1}}}{\mu_{\mathrm{ph,1}}}\frac{D^{3}q}{GM_{1}}\left\{ g(q)[g(q)-\mathcal{A}-q\mathcal{A}]\right\} ^{-\frac{1}{2}}\!. \label{Q} \end{equation}](/articles/aa/full_html/2013/08/aa20391-12/aa20391-12-eq257.png) (A.8)Defining
(A.8)Defining  (A.9)then substituting Eq.
(A.9) into (A.8) gives us
(A.9)then substituting Eq.
(A.9) into (A.8) gives us ![Mathematical equation: \appendix \setcounter{section}{1} \begin{equation} Q=\frac{2\pi\mathcal{R}T_{\mathrm{eff,1}}}{\mu_{\mathrm{ph,1}}}\frac{R_{\L1}^{3}}{GM_{1}} q\,\hat{\beta}^{-3}\,\left\{g(q)[g(q)-\mathcal{A}-q\mathcal{A}]\right\} ^{-\frac{1}{2}}. \label{Q_2} \end{equation}](/articles/aa/full_html/2013/08/aa20391-12/aa20391-12-eq259.png) (A.10)The mass transfer rate
when the donor star exactly fills its Roche lobe, Ṁ0, is given
by (Ritter 1988)
(A.10)The mass transfer rate
when the donor star exactly fills its Roche lobe, Ṁ0, is given
by (Ritter 1988)  (A.11)where
 (A.12)is the sound velocity of
the material in the location of the ℒ1 point. Substituting Eqs. (A.10) and (A.12) into (A.11) and
comparing the result with Eq. (8) gives us
(A.12)is the sound velocity of
the material in the location of the ℒ1 point. Substituting Eqs. (A.10) and (A.12) into (A.11) and
comparing the result with Eq. (8) gives us
![Mathematical equation: \appendix \setcounter{section}{1} \begin{eqnarray} \dot{M}_{0} & = & \frac{2\pi}{\sqrt{e}}q\hat{\beta}^{-3}\left\{g(q)[g(q)-\mathcal{A}q-\mathcal{A}]\right\}^{-1/2} \nonumber \\ & & \times\frac{R_{\L1}^3}{GM_{1}}\left(\frac{\mathcal{R}T_{\mathrm{eff,1}}}{\mu_{\mathrm{ph,1}}}\right)^{3/2}\rho_{\mathrm{ph,1}}, \nonumber \\ & = & \frac{2\pi}{\sqrt{e}}F^{\star}(\mathcal{A},q)\frac{R_{\L1}^3}{GM_{1}}\left(\frac{\mathcal{R}T_{\mathrm{eff,1}}}{\mu_{\mathrm{ph,1}}}\right)^{3/2}\rho_{\mathrm{ph,1}}, \label{mdot_0_appendix} \end{eqnarray}](/articles/aa/full_html/2013/08/aa20391-12/aa20391-12-eq262.png) (A.13)where
(A.13)where
![Mathematical equation: \appendix \setcounter{section}{1} \begin{equation} F^{*}(A,q)=q\hat{\beta}^{-3}\left\{g(q)[g(q)-\mathcal{A}q-\mathcal{A}]\right\}^{-1/2}, \label{F_star_appendix} \end{equation}](/articles/aa/full_html/2013/08/aa20391-12/aa20391-12-eq263.png) (A.14)as given by Eq.
(13).
(A.14)as given by Eq.
(13).
Finally, the pressure scale scale height at the location of the ℒ1 point is
calculated using  (A.15)where
γ(q) takes the non-spherical shape of the donor’s
Roche lobe into account, and is given by (Ritter 1988)
(A.15)where
γ(q) takes the non-spherical shape of the donor’s
Roche lobe into account, and is given by (Ritter 1988) 
All Figures
|
Fig. 1 Mass loss rate, Ṁ1, during the first periastron passage
as a function of time since apastron, in units of Porb
when the effects of tides and rotation on the donor’s structure are ignored (black,
solid curve) or included (red, dotted curve). The red squares labelled (a) to (f) on
the black curve indicate different moments in time, and correspond to the panels
labelled (a) to (f) in Figs. 2 and 6. The inset shows the evolution of the timescale
over which the mass transfer rate changes, |
| In the text | |
|
Fig. 2 Stellar luminosity profile, Lr (black
solid curve, left axis), and contributions from the homologous,
|
| In the text | |
|
Fig. 3 Evolution of the surface luminosity for the donor, L1 (left panel), and of the accretor, L2 (right panel) during mass transfer at the first periastron passage. The meaning of the lines are the same as for Fig. 1. Points labelled (a) to (f) correspond to the points labelled (a) to (f) in Fig. 1. |
| In the text | |
|
Fig. 4 Similar to Fig. 3, but now depicting the evolution of the radius for the donor R1 (left panel) and the accretor R2 (right panel) during the first periastron passage. |
| In the text | |
|
Fig. 5 Evolution of the surface luminosity of the donor L1 (solid black curve, left axis) and of the accretor L2 (dashed red curve, right axis) just before mass transfer recommences over a duration of about 30 periastron passages. |
| In the text | |
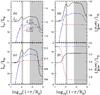 |
Fig. 6 Similar to Fig. 2 but now for the accretor.
Note that |
| In the text | |
|
Fig. 7 Left panel, left axis: similar to Fig. 1, but here the effects of asynchronism and eccentricity on the Roche lobe radius are taken into account (Eqs. (3) and (4)). Black, solid curve: standard Roche lobe formalism; red, dotted curve: f = 0.90; green, short-dashed curve: f = 1.00; blue, long-dashed curve: f = 1.02. Right panel, right axis: the same but for the distorted models. |
| In the text | |
|
Fig. 8 Relative difference between the donor radius and its Roche lobe radius at periastron, [(R1 − Rℒ1)/R1] peri (top panel), and the duration of mass transfer, ttransfer, in units of the orbital period (bottom panel), as a function of f for our 1.50 M⊙ donor. |
| In the text | |
|
Fig. 9 Top panel: accretion efficiency, β = |Ṁ2/Ṁ1 | versus time for the distorted models, where Rℒ1 is determined from Eqs. (3) and (4), with f = 1.00 (black, solid curve) and f = 1.02 (red, dotted curve). Bottom panel: mass of ejected material, Mej (in units of 10-8M⊙), as a function of time. |
| In the text | |
Current usage metrics show cumulative count of Article Views (full-text article views including HTML views, PDF and ePub downloads, according to the available data) and Abstracts Views on Vision4Press platform.
Data correspond to usage on the plateform after 2015. The current usage metrics is available 48-96 hours after online publication and is updated daily on week days.
Initial download of the metrics may take a while.