Fig. 2
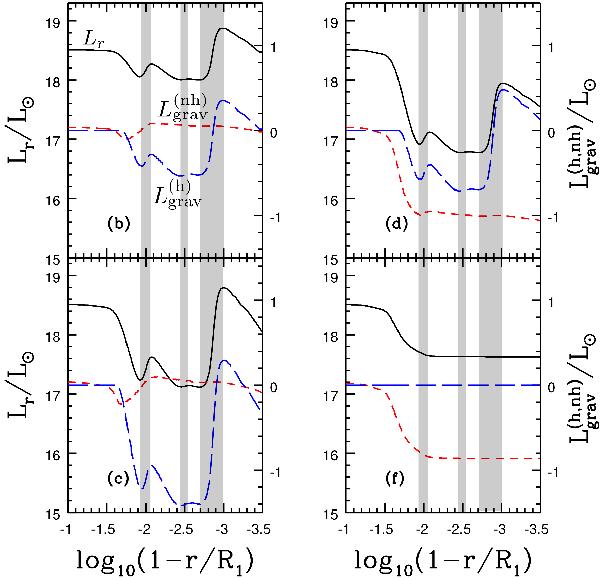
Stellar luminosity profile, Lr (black
solid curve, left axis), and contributions from the homologous,
 (blue, short-dashed curve, right axis) and the non-homologous,
 (red, long-dashed curve, right axis) terms for the non-distorted donor star at
different moments in time, specified in the bottom left-hand corner of each panel
(see Fig. 1). The shaded regions indicate
convection zones.
(red, long-dashed curve, right axis) terms for the non-distorted donor star at
different moments in time, specified in the bottom left-hand corner of each panel
(see Fig. 1). The shaded regions indicate
convection zones.
Current usage metrics show cumulative count of Article Views (full-text article views including HTML views, PDF and ePub downloads, according to the available data) and Abstracts Views on Vision4Press platform.
Data correspond to usage on the plateform after 2015. The current usage metrics is available 48-96 hours after online publication and is updated daily on week days.
Initial download of the metrics may take a while.