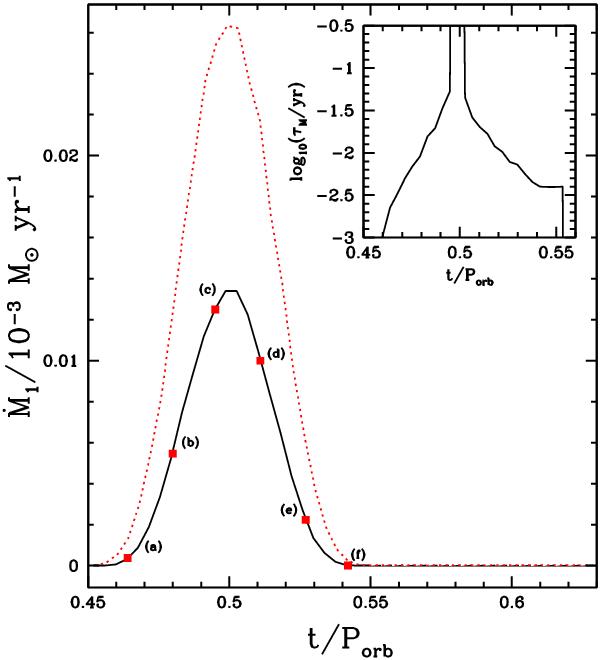
Fig. 1

Mass loss rate, Ṁ1, during the first periastron passage
as a function of time since apastron, in units of Porb
when the effects of tides and rotation on the donor’s structure are ignored (black,
solid curve) or included (red, dotted curve). The red squares labelled (a) to (f) on
the black curve indicate different moments in time, and correspond to the panels
labelled (a) to (f) in Figs. 2 and 6. The inset shows the evolution of the timescale
over which the mass transfer rate changes,  for
the non-distorted model.
Current usage metrics show cumulative count of Article Views (full-text article views including HTML views, PDF and ePub downloads, according to the available data) and Abstracts Views on Vision4Press platform.
Data correspond to usage on the plateform after 2015. The current usage metrics is available 48-96 hours after online publication and is updated daily on week days.
Initial download of the metrics may take a while.


