Fig. 8
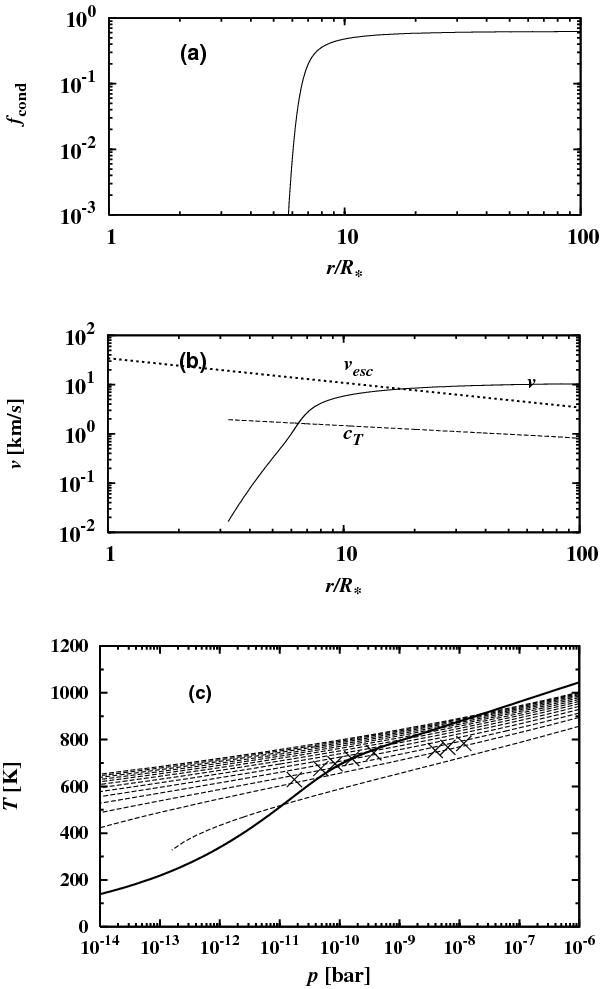
Some results for a wind model with Ṁ = 5 × 10⁻⁶ M⊙ yr-1. a) Variation in the degree of condensation of Si into silicate dust with radial distance from the mass centre. b) Radial variation with distance of outflow velocity v (solid line), sonic velocity cT (dashed line), and escape velocity from star (dotted line). c) Variation in p and T along the wind (solid line) and lines of constant nucleation rate (dashed lines). The crosses denote the pressure and temperature at the inner edge of the dust shell for the models of Table 1.
Current usage metrics show cumulative count of Article Views (full-text article views including HTML views, PDF and ePub downloads, according to the available data) and Abstracts Views on Vision4Press platform.
Data correspond to usage on the plateform after 2015. The current usage metrics is available 48-96 hours after online publication and is updated daily on week days.
Initial download of the metrics may take a while.